 4
4peptides
spectra
0.000 | 0.049
0.000 | 0.000
0.000 | 0.097
0.010 | 0.141
0.347 | 0.628
0.087 | 0.333
0.040 | 0.176
0.000 | 0.047
1peptide
spectra
0.000 | 0.001
0.999 | 1.000
| Plot | Mito | Lyso | Perox | ER | Golgi | PM | Cytosol | Nucleus | |||||
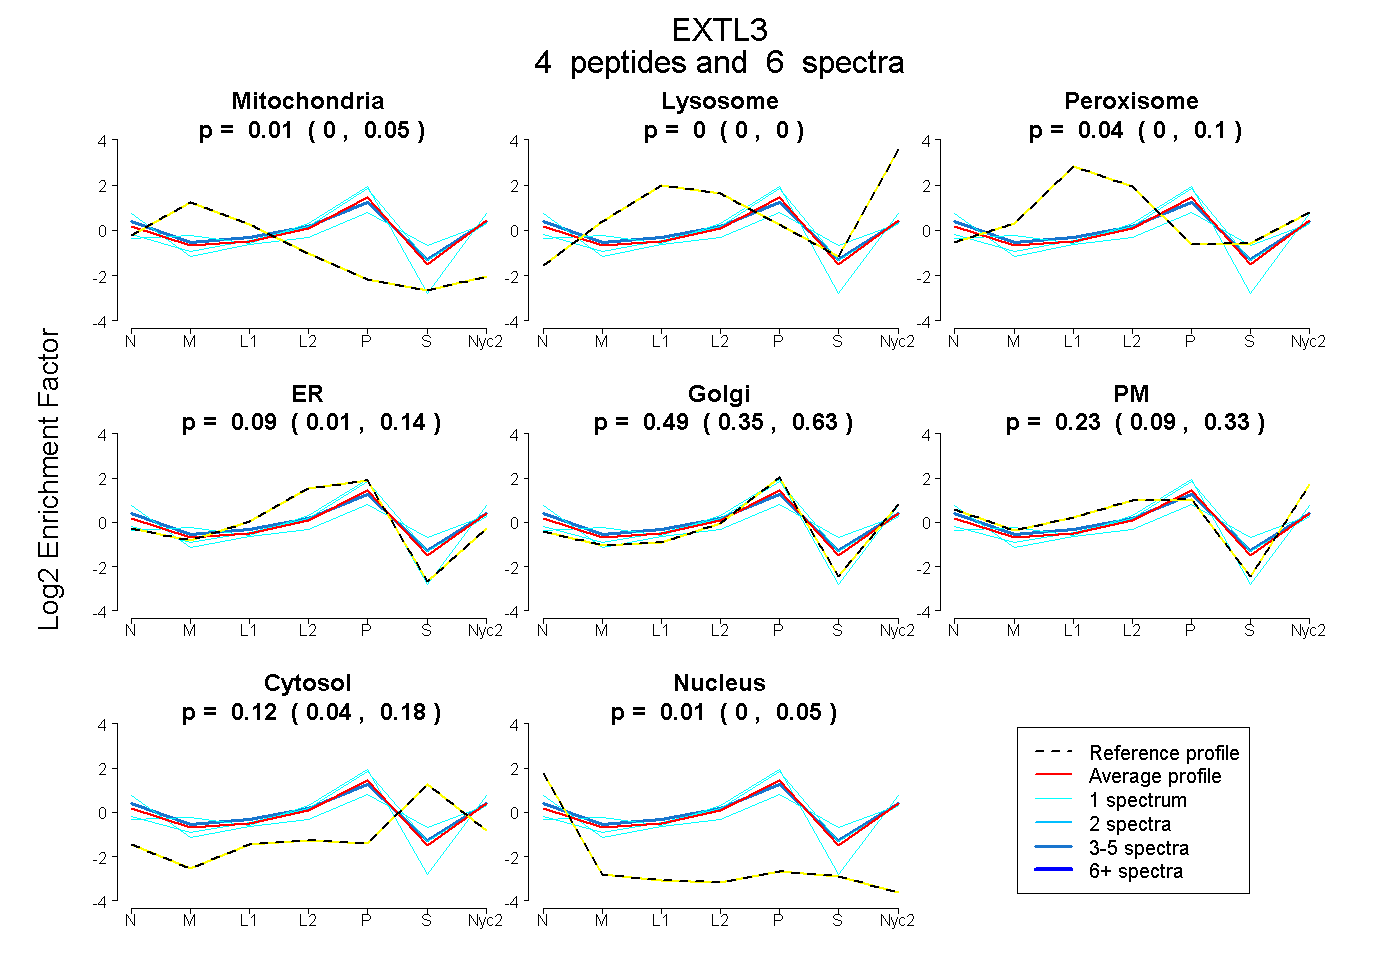
| Expt A |
4 peptides |
6 spectra |
|
0.014 0.000 | 0.049 |
0.000 0.000 | 0.000 |
0.044 0.000 | 0.097 |
0.085 0.010 | 0.141 |
0.490 0.347 | 0.628 |
0.229 0.087 | 0.333 |
0.124 0.040 | 0.176 |
0.014 0.000 | 0.047 |
||
| Plot | Lyso | Other | |||||||||||
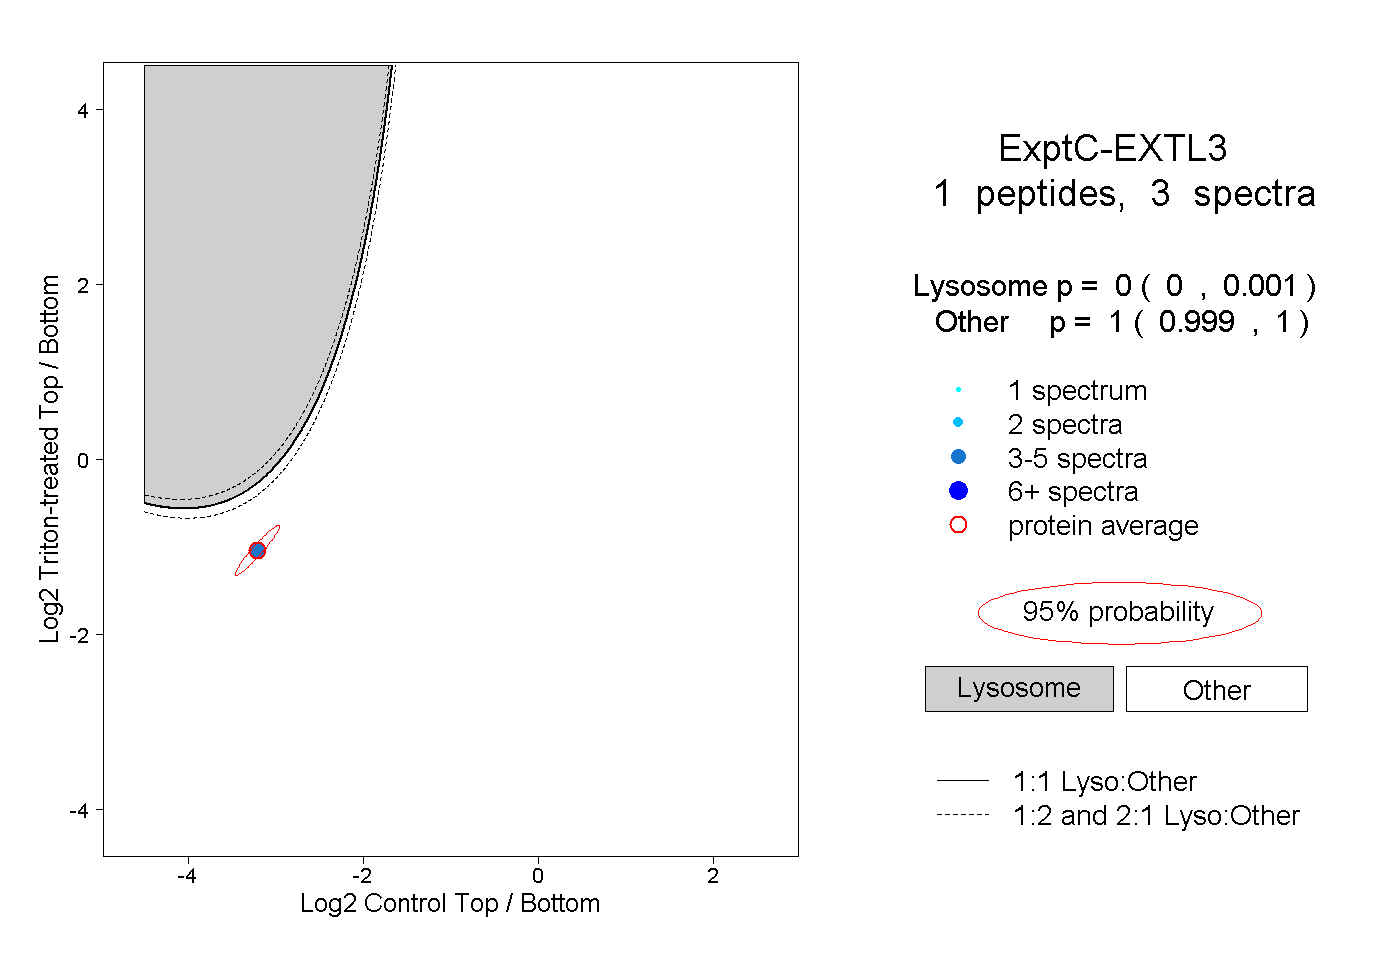
| Expt C |
1 peptide |
3 spectra |
|
0.000 0.000 | 0.001 |
1.000 0.999 | 1.000 |