 4
4peptides
spectra
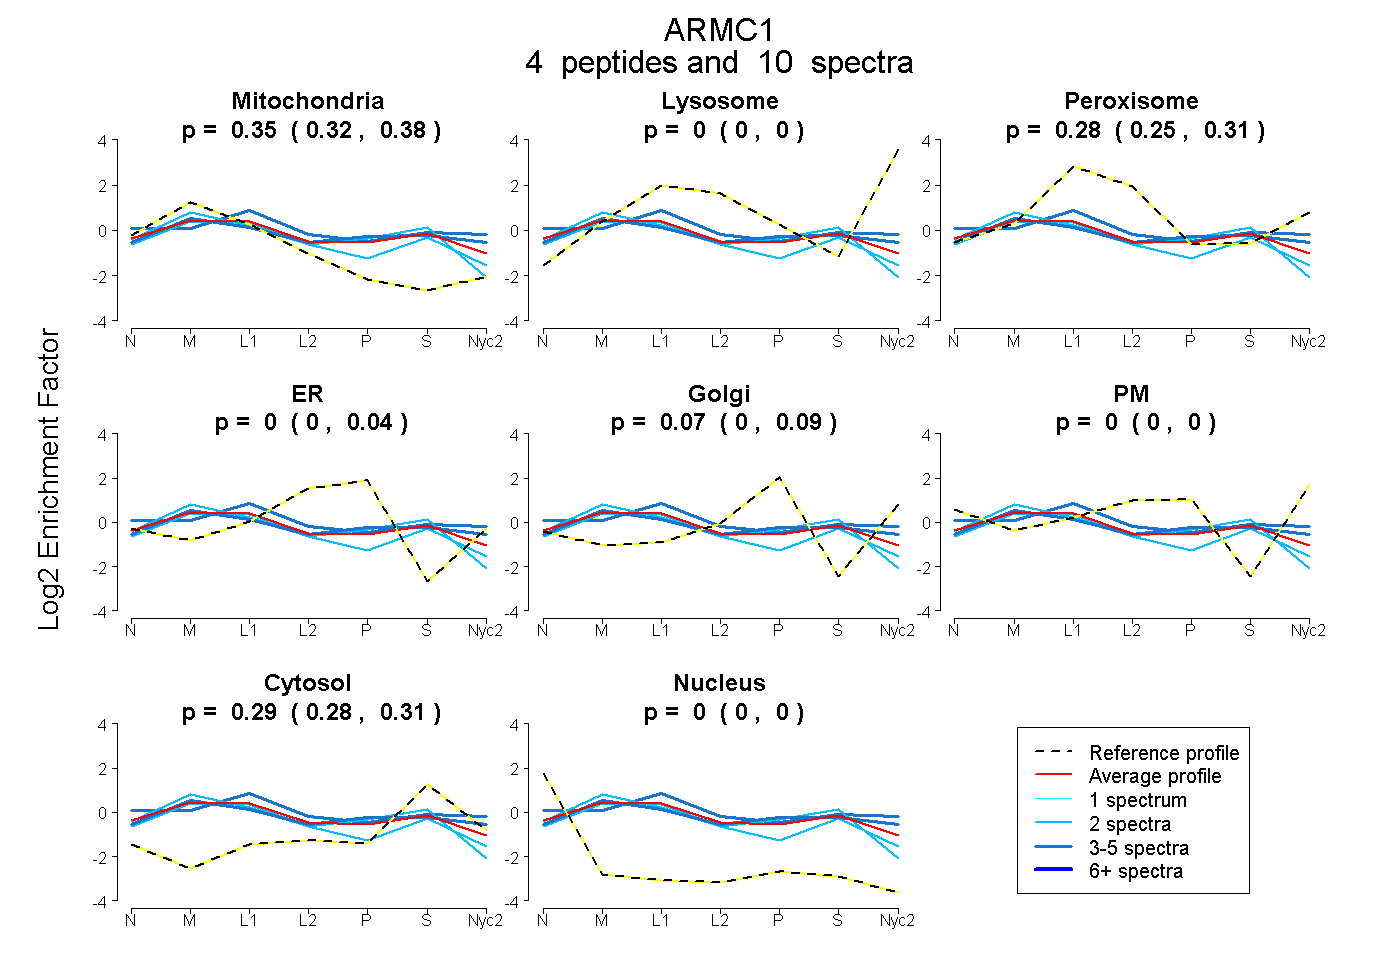
0.318 | 0.380
0.000 | 0.000
0.250 | 0.305
0.000 | 0.044
0.000 | 0.094
0.000 | 0.000
0.278 | 0.311
0.000 | 0.000
5peptides
spectra
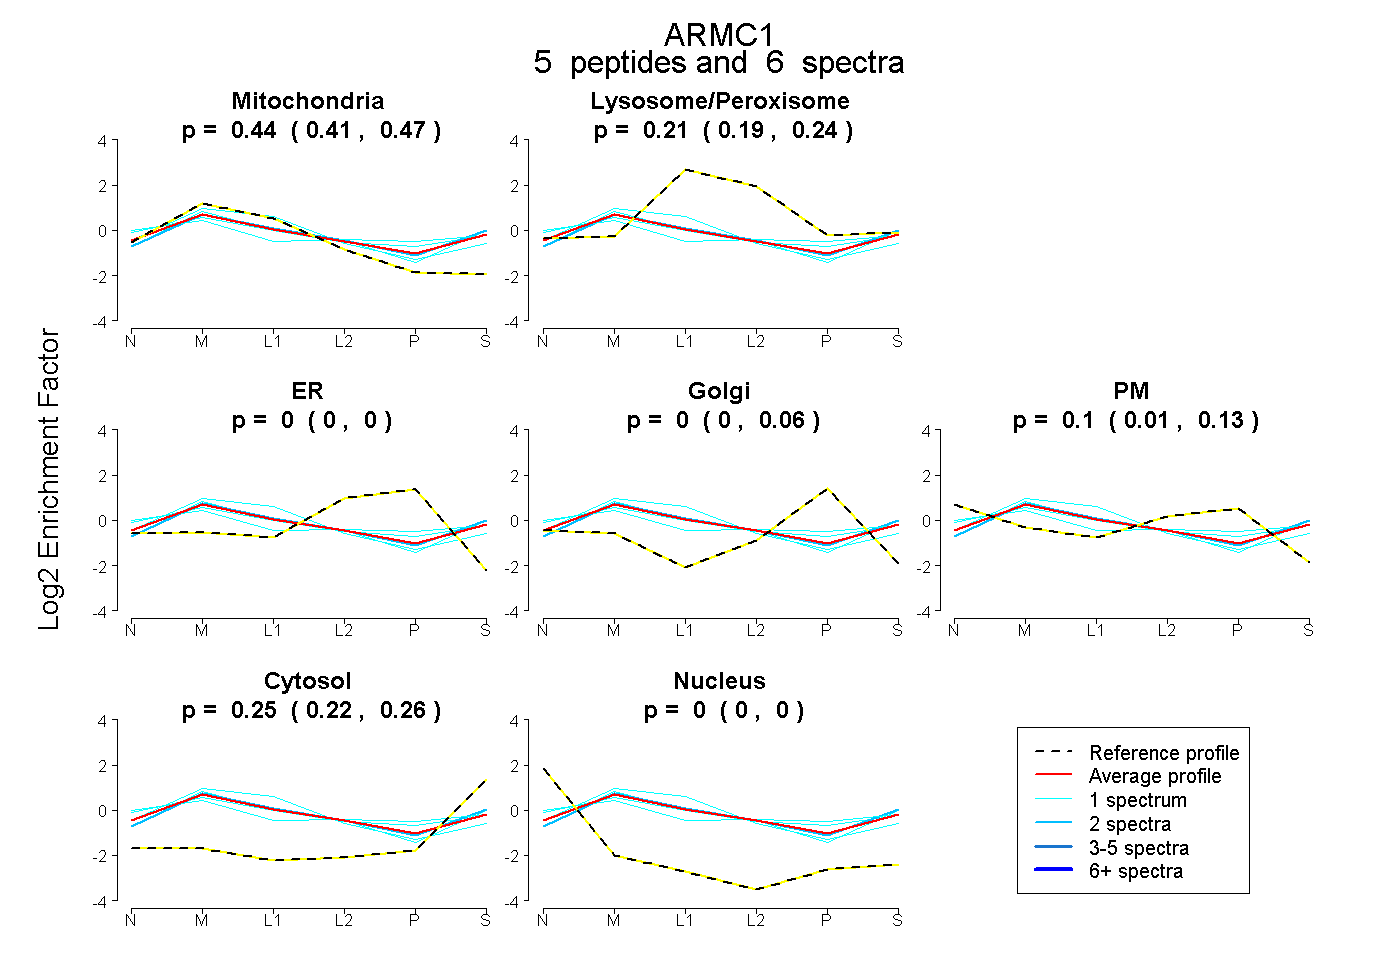
0.408 | 0.468
0.192 | 0.242
0.000 | 0.000
0.000 | 0.056
0.011 | 0.131
0.222 | 0.260
0.000 | 0.000
6peptides
spectra

0.000 | 0.000
1.000 | 1.000
2peptides
spectra
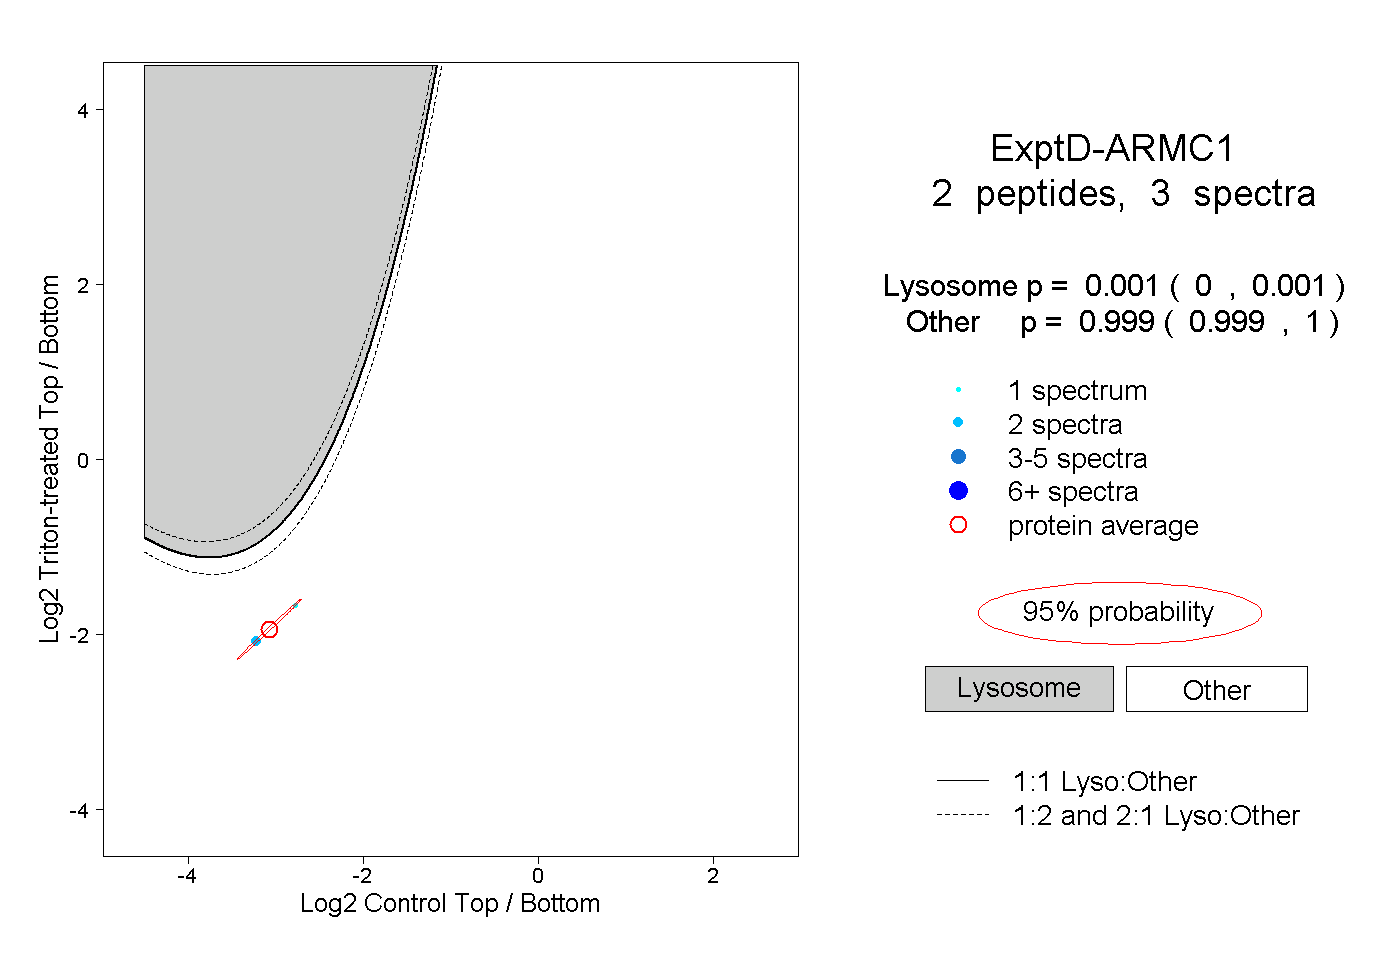
0.000 | 0.001
0.999 | 1.000