 7
7peptides
spectra
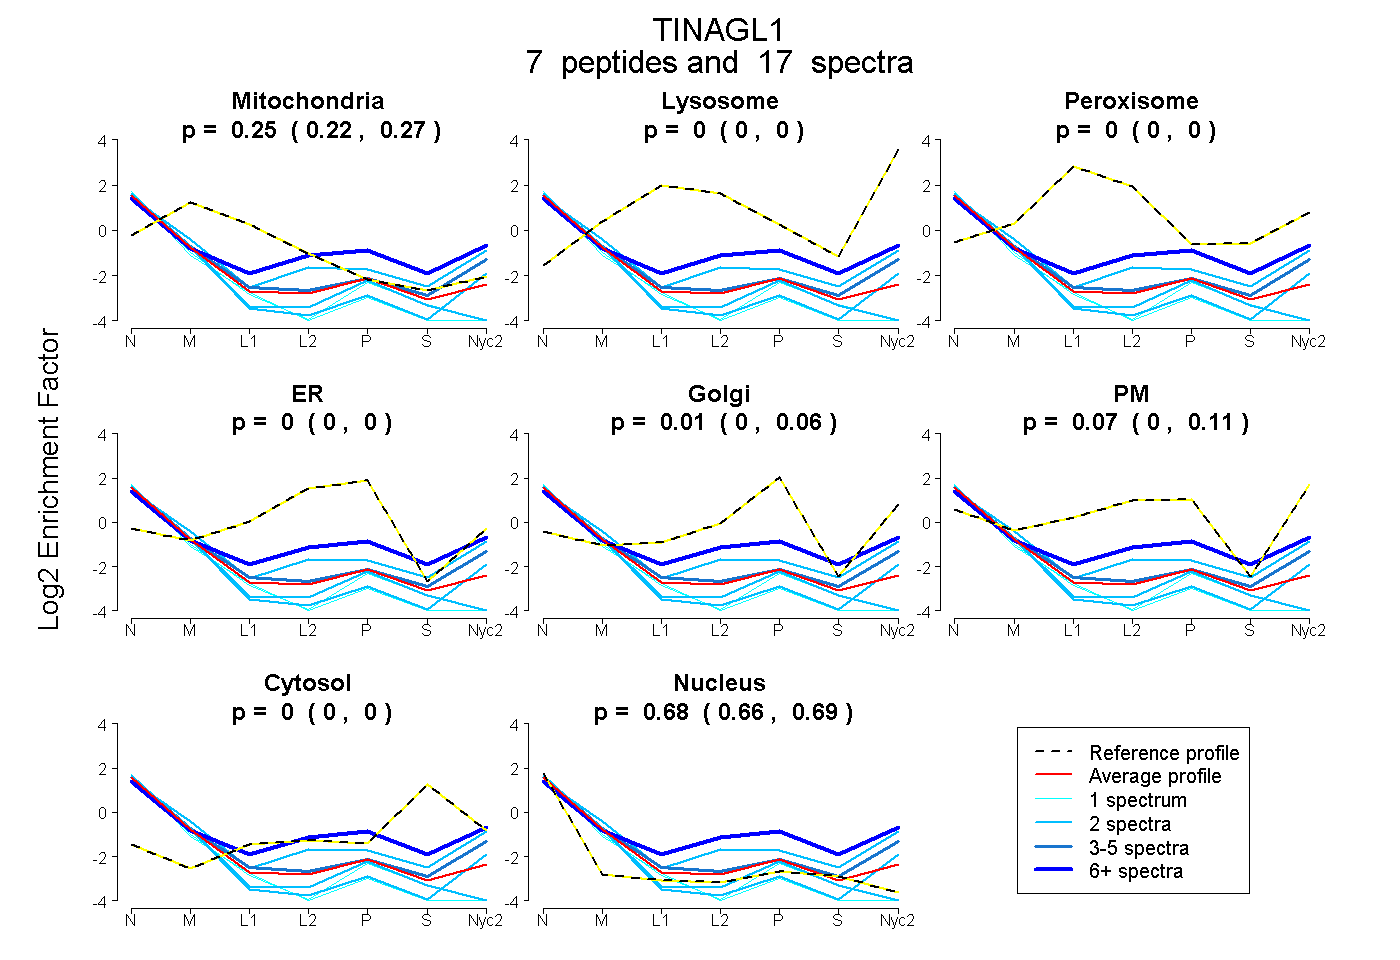
0.217 | 0.271
0.000 | 0.000
0.000 | 0.000
0.000 | 0.000
0.000 | 0.055
0.000 | 0.105
0.000 | 0.000
0.660 | 0.686
1peptide
spectra
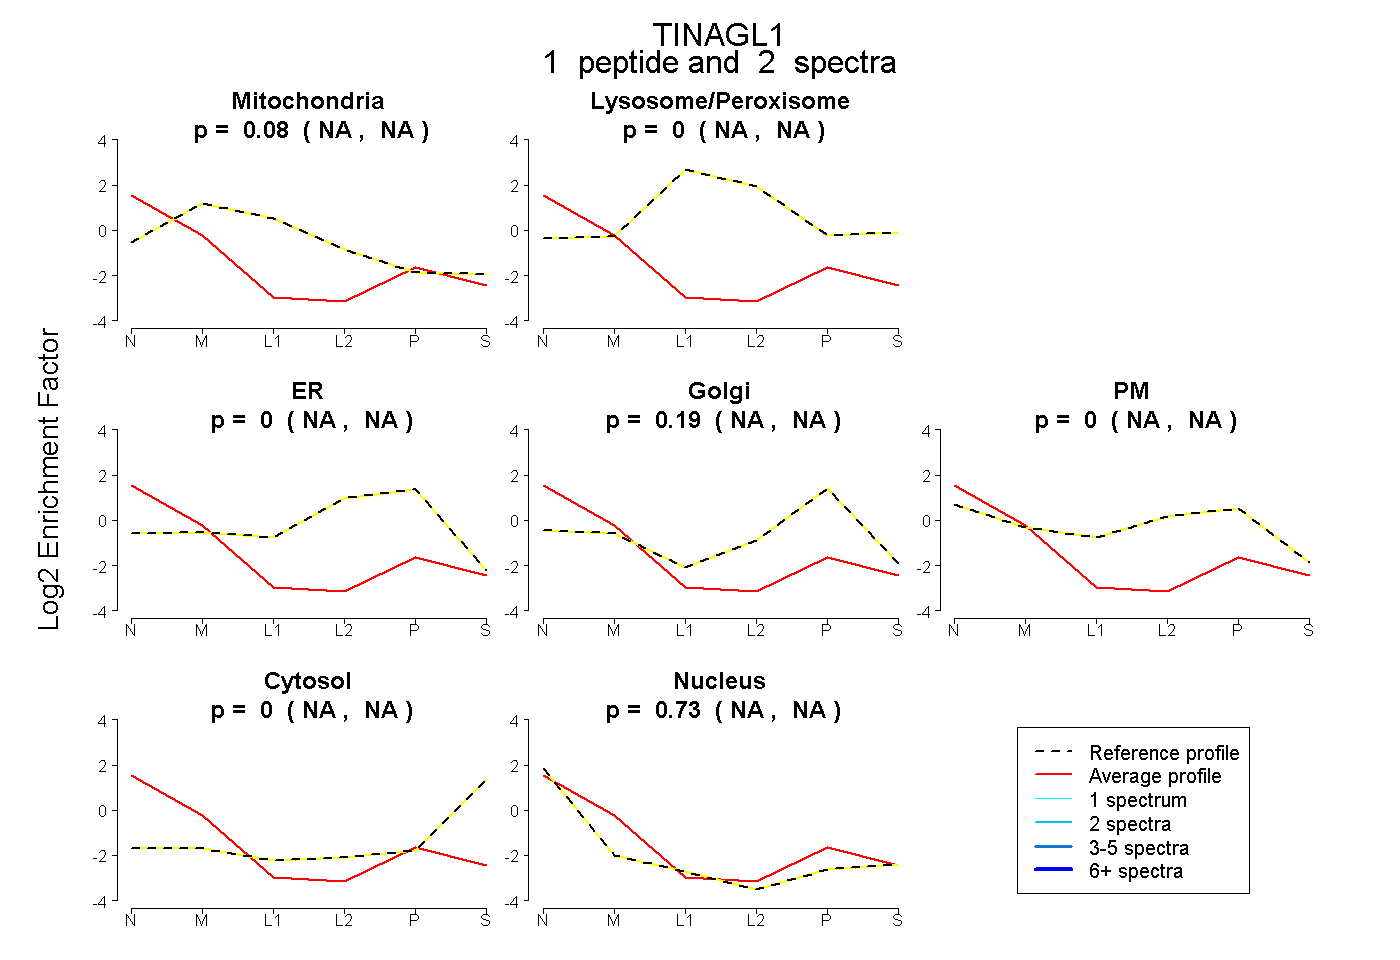
NA | NA
NA | NA
NA | NA
NA | NA
NA | NA
NA | NA
NA | NA
1peptide
spectrum
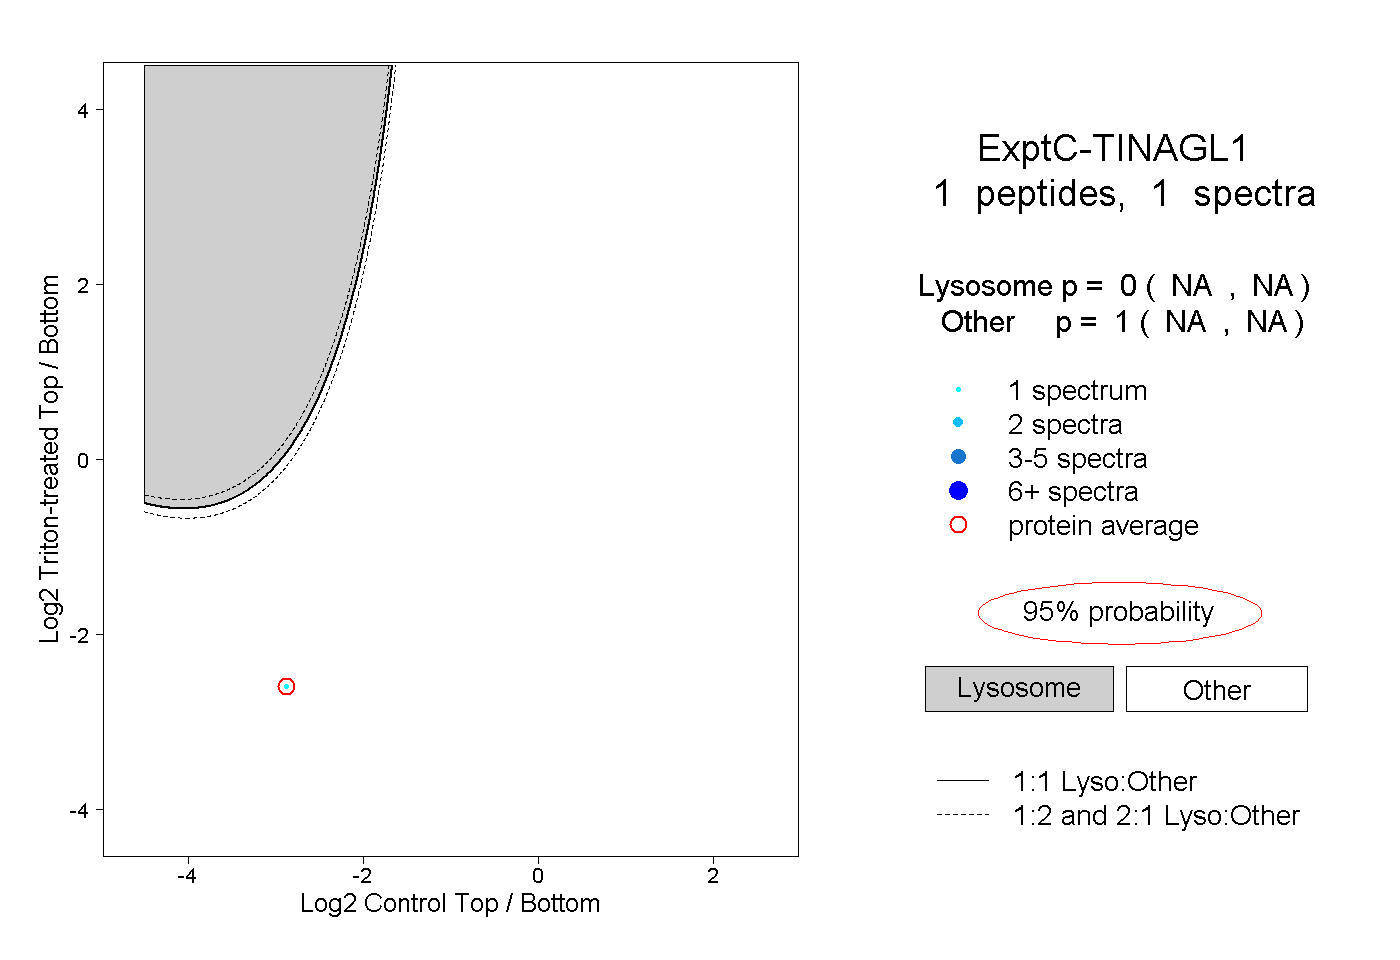
NA | NA
NA | NA