5
5peptides
spectra
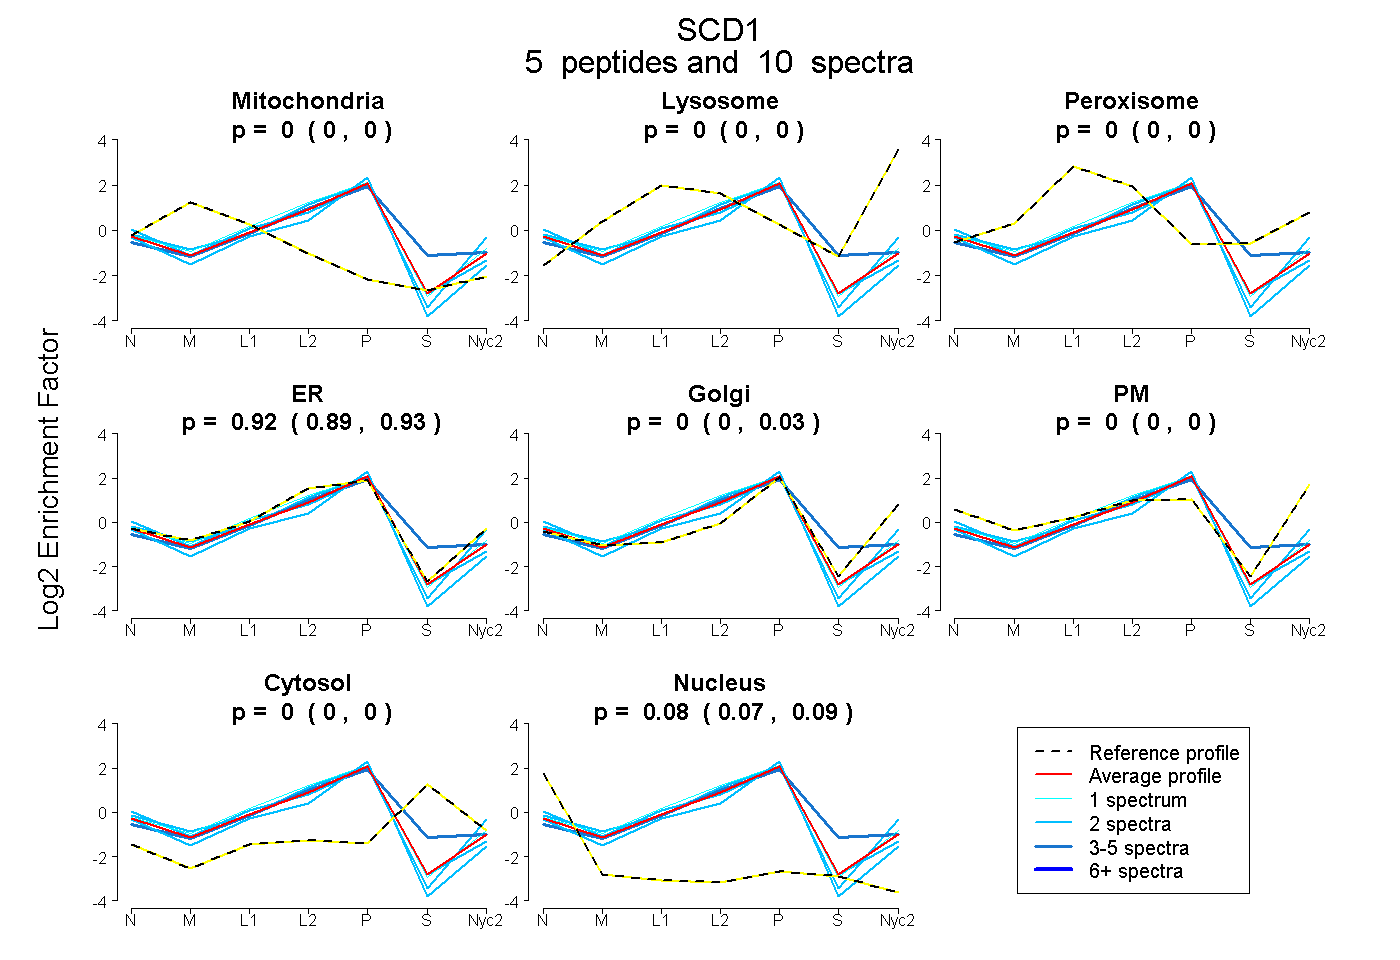
0.000 | 0.000
0.000 | 0.000
0.000 | 0.000
0.887 | 0.926
0.000 | 0.027
0.000 | 0.000
0.000 | 0.000
0.069 | 0.088
3peptides
spectra
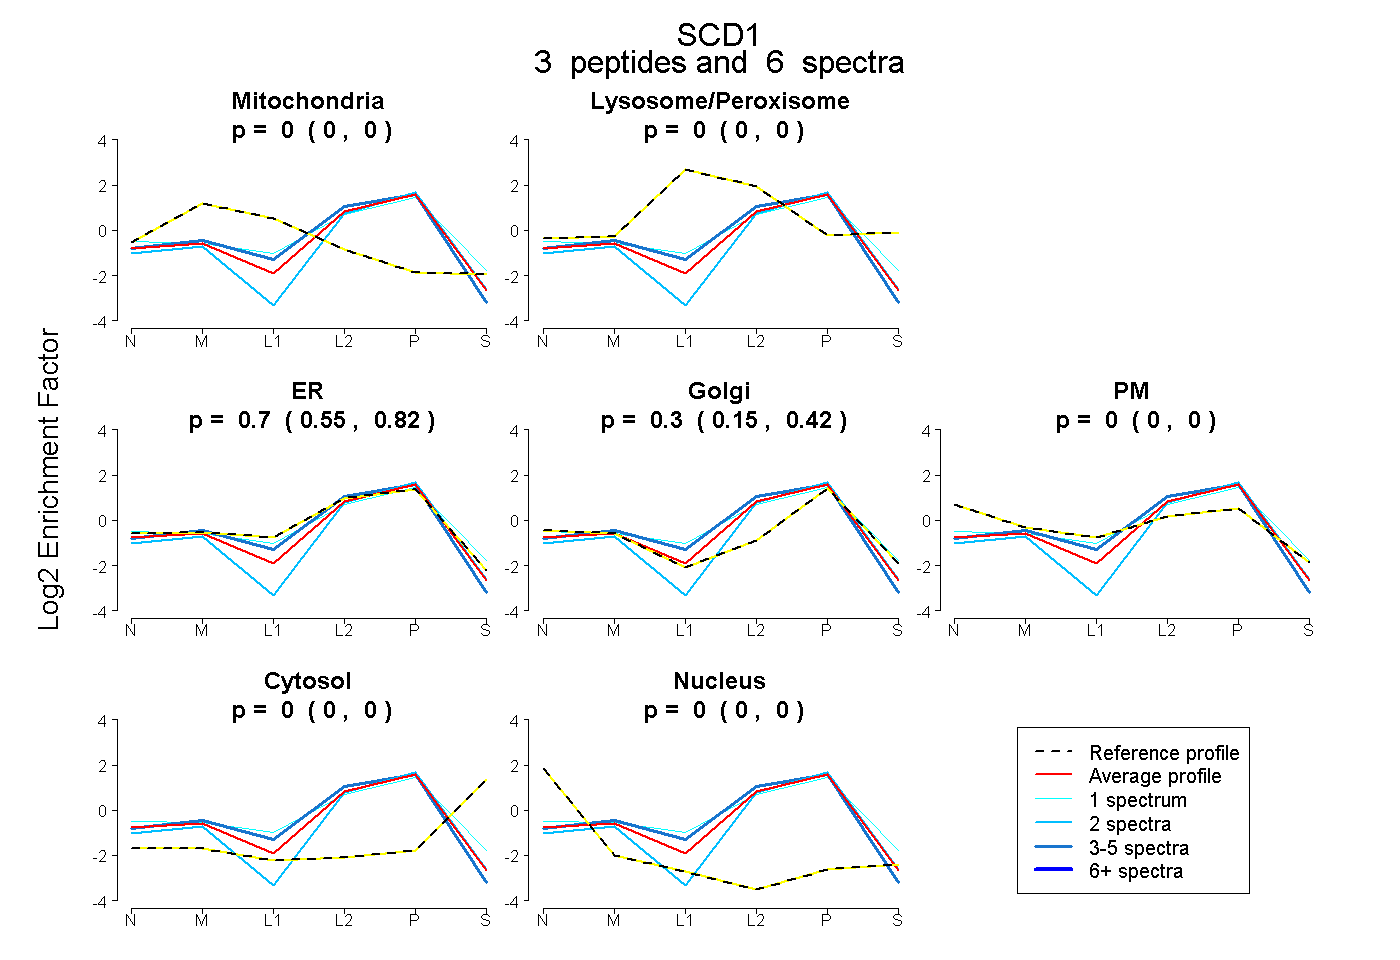
0.000 | 0.000
0.000 | 0.000
0.548 | 0.821
0.153 | 0.423
0.000 | 0.000
0.000 | 0.000
0.000 | 0.000