 24
24peptides
spectra
0.021 | 0.036
0.000 | 0.000
0.000 | 0.000
0.000 | 0.000
0.000 | 0.000
0.038 | 0.047
0.877 | 0.882
0.044 | 0.052
| Plot | Mito | Lyso | Perox | ER | Golgi | PM | Cytosol | Nucleus | |||||
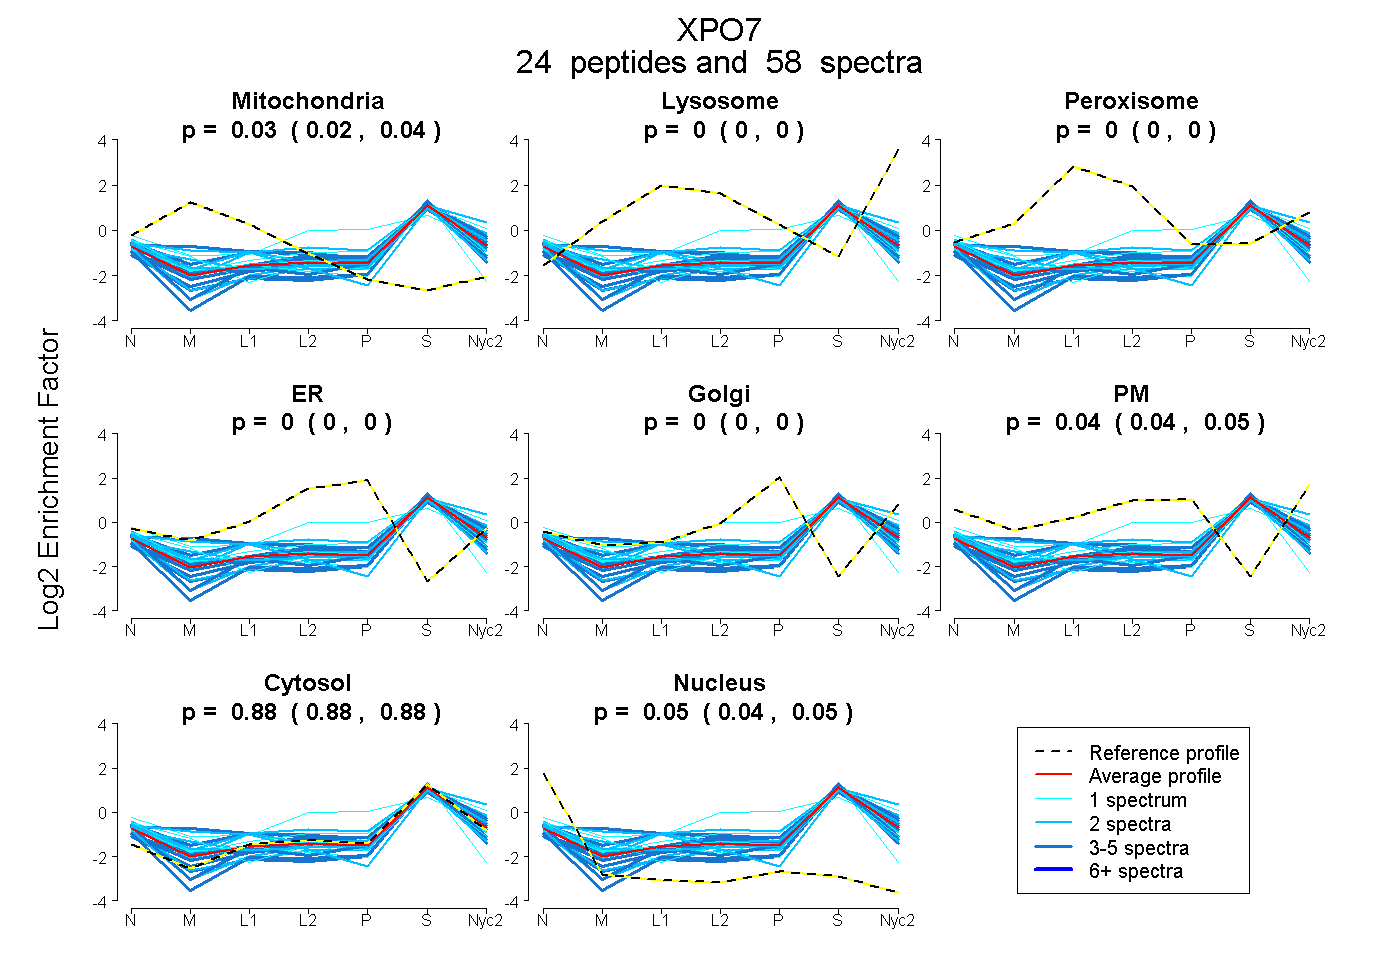
| Expt A |
24 peptides |
58 spectra |
|
0.030 0.021 | 0.036 |
0.000 0.000 | 0.000 |
0.000 0.000 | 0.000 |
0.000 0.000 | 0.000 |
0.000 0.000 | 0.000 |
0.043 0.038 | 0.047 |
0.880 0.877 | 0.882 |
0.048 0.044 | 0.052 |
| 3 spectra, GIAFAFNAK | 0.080 | 0.000 | 0.101 | 0.000 | 0.000 | 0.039 | 0.761 | 0.019 | ||
| 2 spectra, ILENPQSLSDPNNYHEFCR | 0.000 | 0.000 | 0.099 | 0.065 | 0.000 | 0.000 | 0.806 | 0.030 | ||
| 1 spectrum, NYVLNYLATRPK | 0.085 | 0.000 | 0.000 | 0.000 | 0.000 | 0.000 | 0.858 | 0.057 | ||
| 3 spectra, SNYQLGELVK | 0.000 | 0.000 | 0.000 | 0.000 | 0.000 | 0.000 | 0.912 | 0.088 | ||
| 5 spectra, QLYETTDTTTR | 0.000 | 0.000 | 0.000 | 0.000 | 0.000 | 0.000 | 0.853 | 0.147 | ||
| 1 spectrum, DSSLFDIFTLSCNLLK | 0.000 | 0.000 | 0.000 | 0.000 | 0.000 | 0.000 | 0.843 | 0.157 | ||
| 2 spectra, TNNPLPLEQR | 0.000 | 0.014 | 0.000 | 0.000 | 0.000 | 0.139 | 0.847 | 0.000 | ||
| 1 spectrum, AYITSR | 0.000 | 0.000 | 0.055 | 0.187 | 0.000 | 0.149 | 0.609 | 0.000 | ||
| 3 spectra, EVNDSMK | 0.213 | 0.029 | 0.068 | 0.000 | 0.000 | 0.000 | 0.691 | 0.000 | ||
| 2 spectra, VENYPDVIR | 0.283 | 0.000 | 0.000 | 0.000 | 0.000 | 0.000 | 0.711 | 0.007 | ||
| 2 spectra, FTQNLSAFR | 0.019 | 0.048 | 0.000 | 0.000 | 0.000 | 0.040 | 0.843 | 0.050 | ||
| 2 spectra, LLLSIPHSDLLDYPK | 0.000 | 0.000 | 0.000 | 0.000 | 0.000 | 0.000 | 0.891 | 0.109 | ||
| 3 spectra, DDYVFR | 0.000 | 0.000 | 0.000 | 0.000 | 0.000 | 0.000 | 0.858 | 0.142 | ||
| 2 spectra, LAASVPYVK | 0.102 | 0.031 | 0.000 | 0.000 | 0.000 | 0.045 | 0.822 | 0.001 | ||
| 1 spectrum, TTFYTALGR | 0.000 | 0.026 | 0.000 | 0.000 | 0.000 | 0.164 | 0.811 | 0.000 | ||
| 1 spectrum, SLFNNAER | 0.124 | 0.000 | 0.000 | 0.000 | 0.000 | 0.000 | 0.779 | 0.096 | ||
| 2 spectra, YFSDLR | 0.057 | 0.000 | 0.000 | 0.000 | 0.000 | 0.049 | 0.858 | 0.036 | ||
| 1 spectrum, VLQLMNLTDSR | 0.045 | 0.000 | 0.000 | 0.000 | 0.000 | 0.087 | 0.830 | 0.039 | ||
| 5 spectra, FLSHLVDGVK | 0.000 | 0.000 | 0.000 | 0.000 | 0.000 | 0.135 | 0.844 | 0.021 | ||
| 2 spectra, IASSFR | 0.000 | 0.109 | 0.052 | 0.000 | 0.000 | 0.000 | 0.754 | 0.085 | ||
| 4 spectra, LMAELVHNR | 0.000 | 0.000 | 0.000 | 0.000 | 0.000 | 0.034 | 0.922 | 0.044 | ||
| 2 spectra, NAITDVTR | 0.000 | 0.000 | 0.000 | 0.000 | 0.000 | 0.000 | 0.922 | 0.078 | ||
| 3 spectra, LGWFDCQK | 0.000 | 0.000 | 0.000 | 0.000 | 0.000 | 0.000 | 0.929 | 0.071 | ||
| 5 spectra, MITMYGNR | 0.002 | 0.018 | 0.000 | 0.000 | 0.000 | 0.072 | 0.908 | 0.000 |
| Plot | Mito | Lyso or Perox | ER | Golgi | PM | Cytosol | Nucleus | ||||||
| Expt B |
5 peptides |
8 spectra |
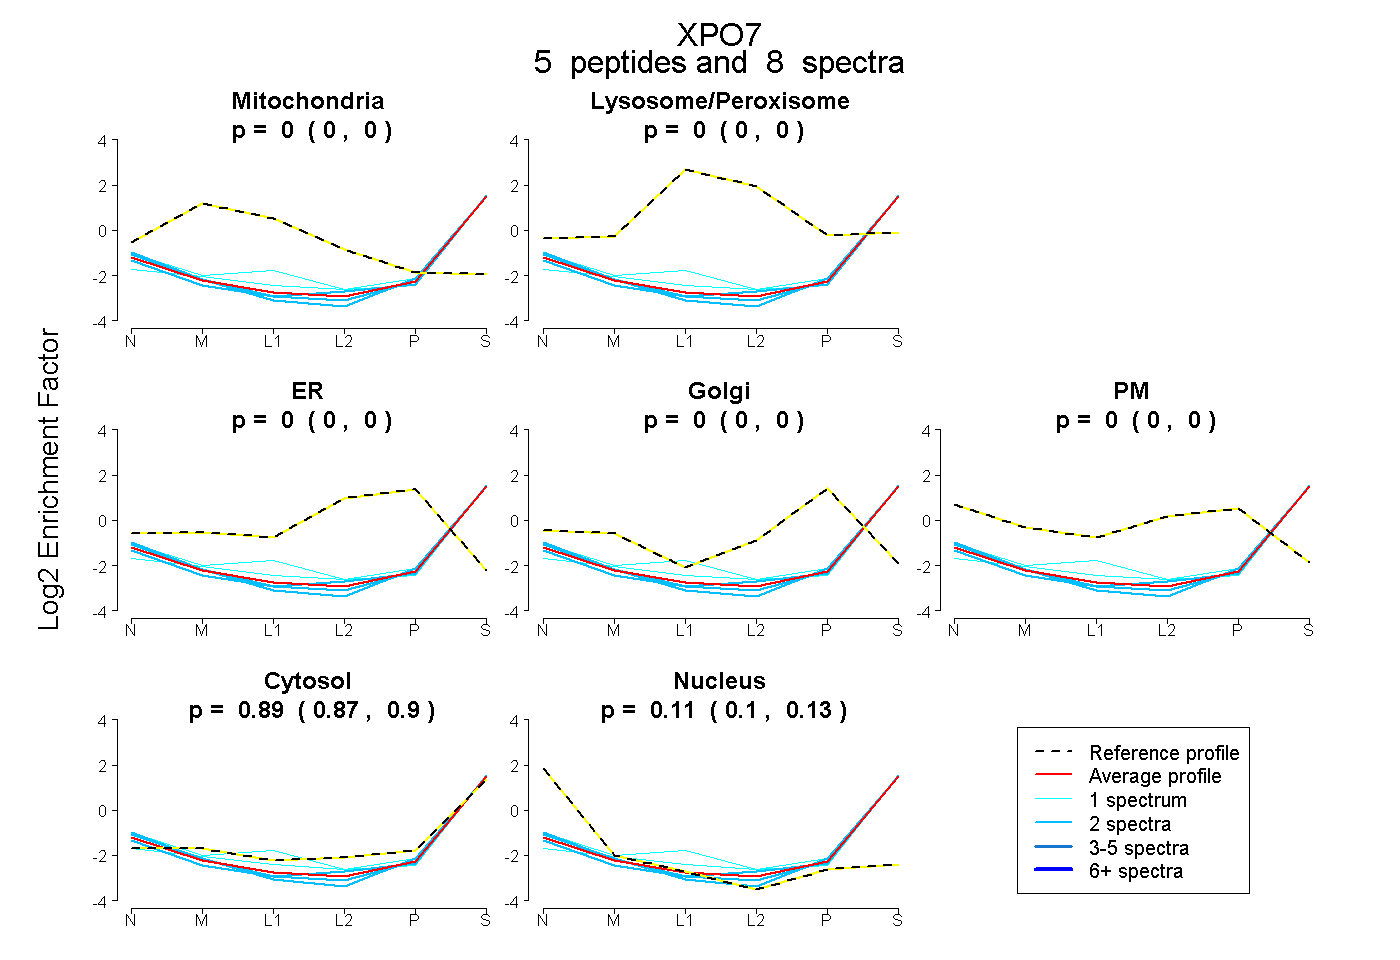 |
0.000 0.000 | 0.000 |
0.000 0.000 | 0.000 |
0.000 0.000 | 0.000 |
0.000 0.000 | 0.000 |
0.000 0.000 | 0.000 |
0.885 0.872 | 0.896 |
0.115 0.103 | 0.125 |
|||
| Plot | Lyso | Other | |||||||||||
| Expt C |
12 peptides |
28 spectra |
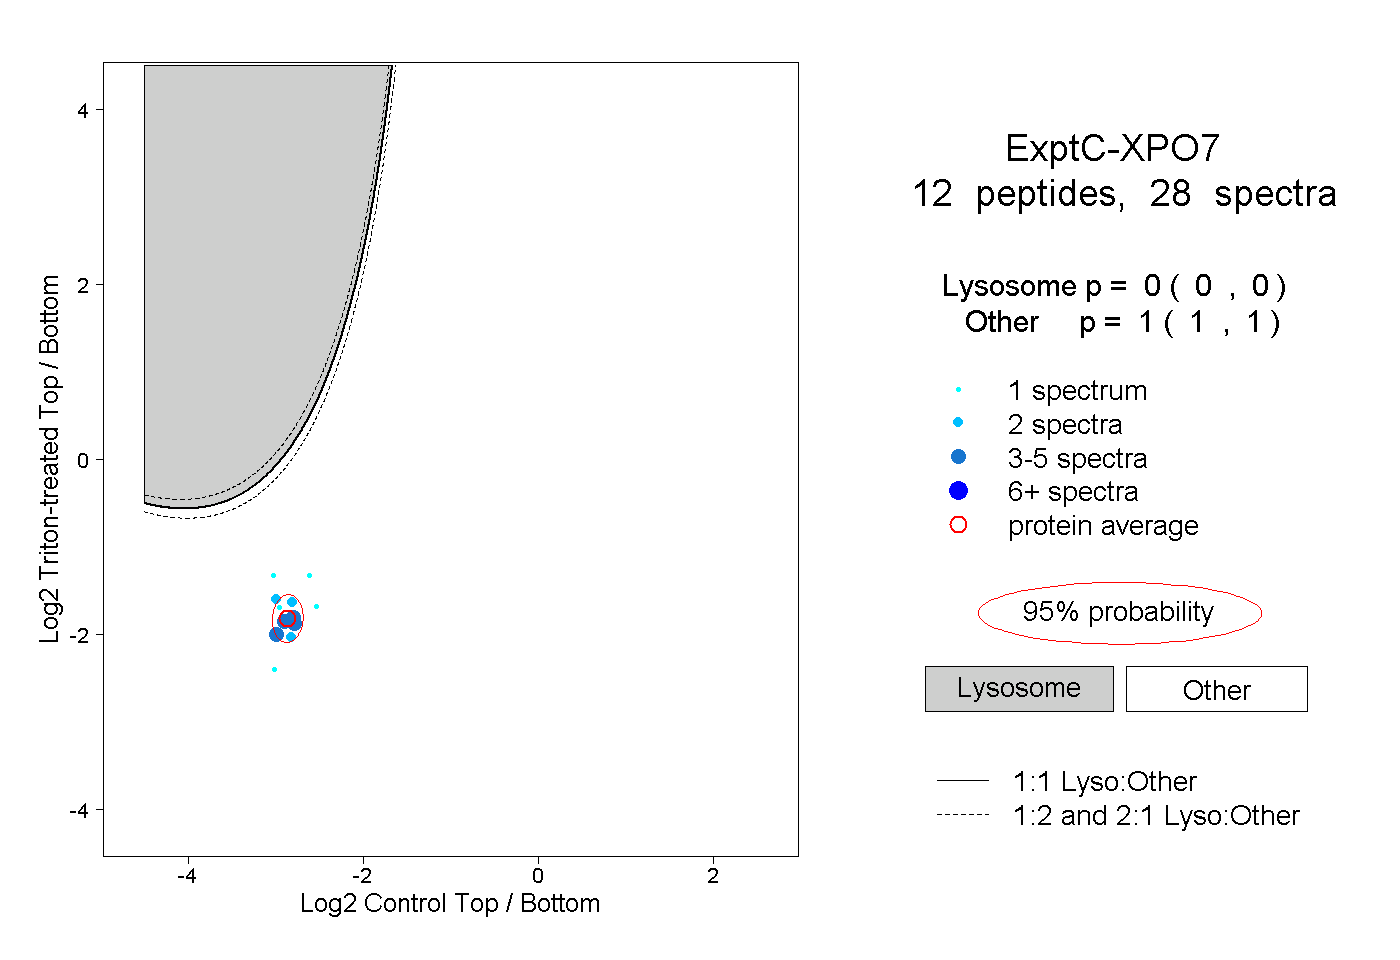 |
0.000 0.000 | 0.000 |
1.000 1.000 | 1.000 |