 2
2peptides
spectra
NA | NA
NA | NA
NA | NA
NA | NA
NA | NA
NA | NA
NA | NA
NA | NA
1peptide
spectra
0.000 | 0.005
0.995 | 1.000
| Plot | Mito | Lyso | Perox | ER | Golgi | PM | Cytosol | Nucleus | |||||
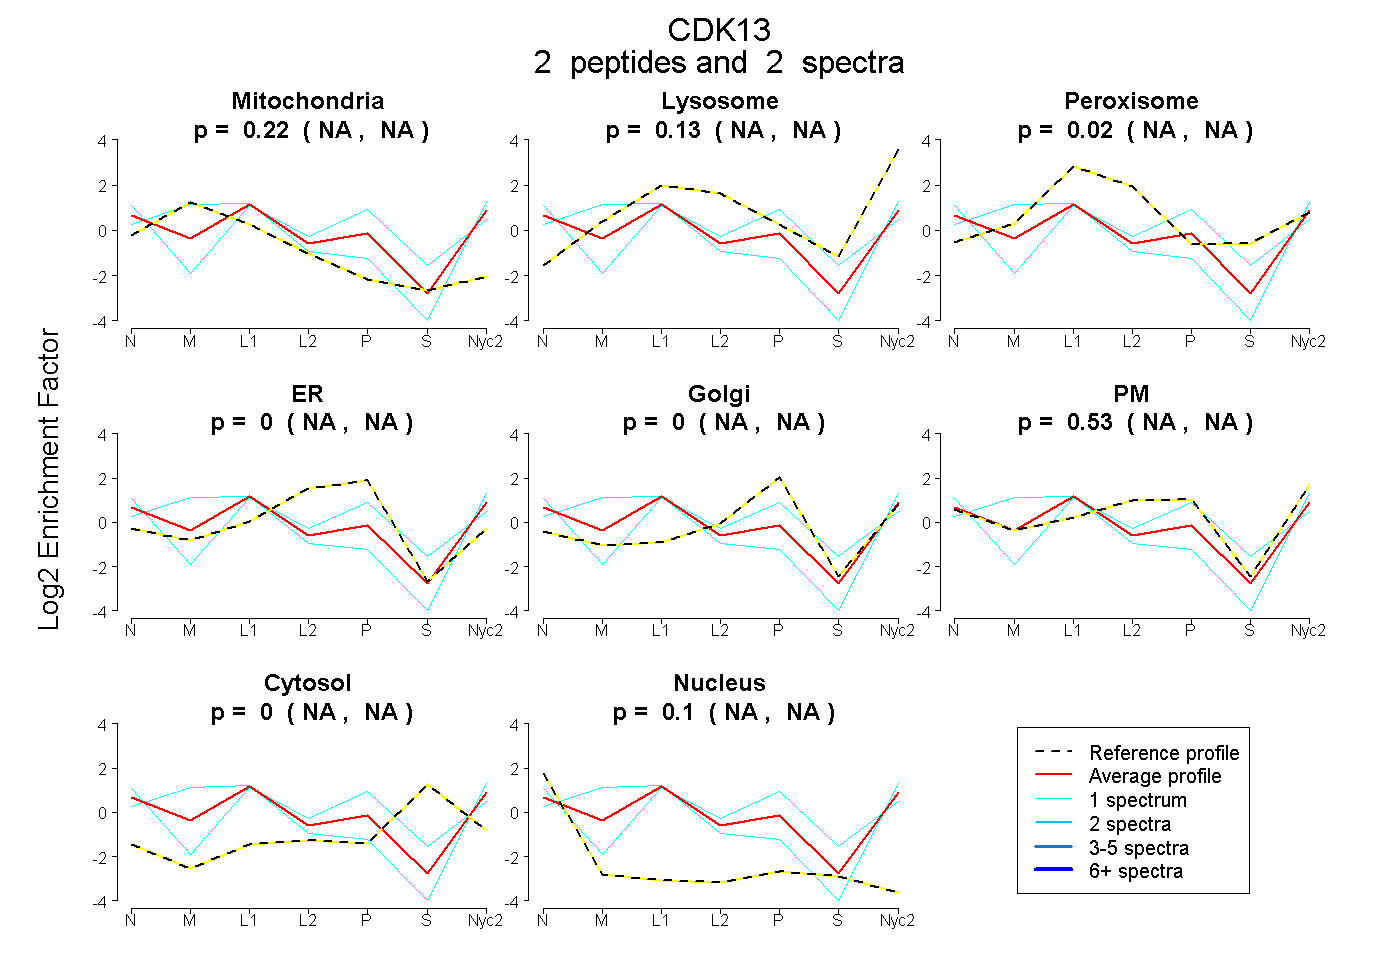
| Expt A |
2 peptides |
2 spectra |
|
0.215 NA | NA |
0.133 NA | NA |
0.020 NA | NA |
0.000 NA | NA |
0.000 NA | NA |
0.533 NA | NA |
0.000 NA | NA |
0.099 NA | NA |
||
| Plot | Lyso | Other | |||||||||||
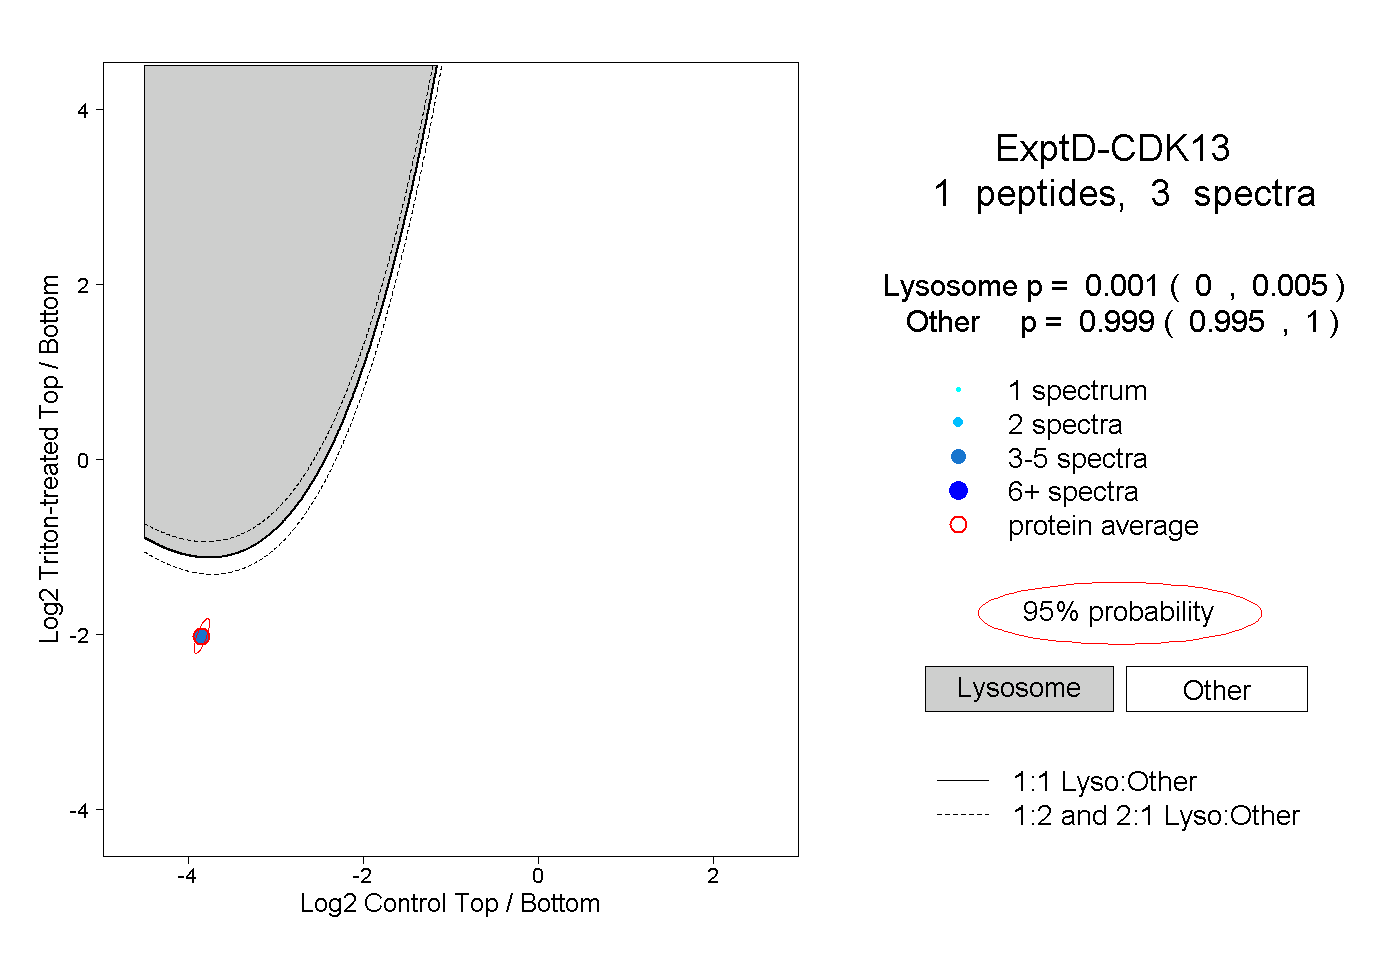
| Expt D |
1 peptide |
3 spectra |
|
0.001 0.000 | 0.005 |
0.999 0.995 | 1.000 |