 26
26peptides
spectra
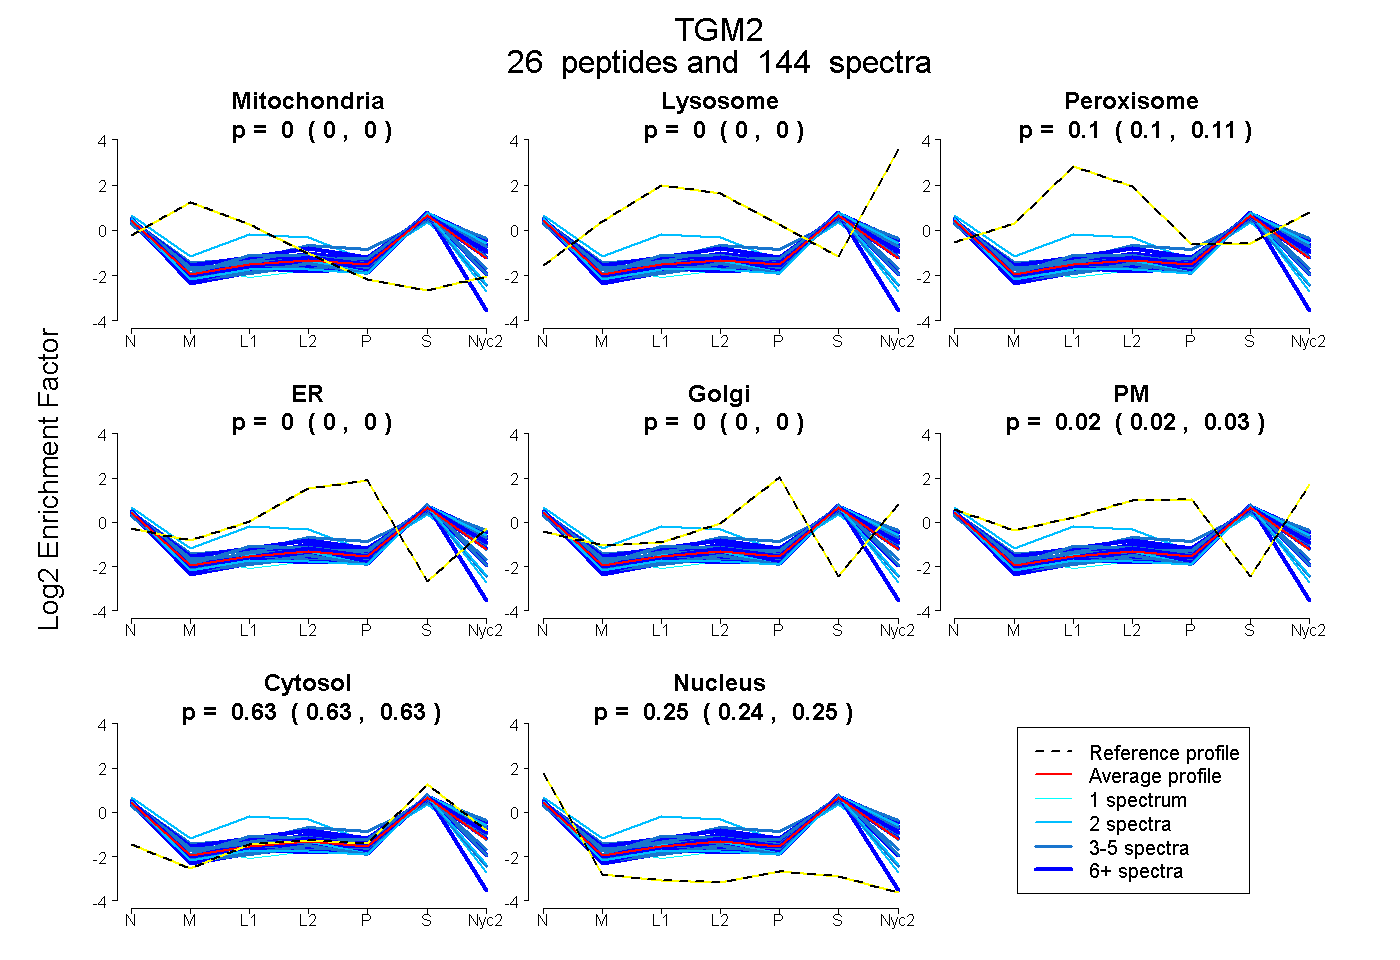
0.000 | 0.000
0.000 | 0.000
0.100 | 0.108
0.000 | 0.000
0.000 | 0.000
0.019 | 0.027
0.625 | 0.629
0.242 | 0.247
14peptides
spectra
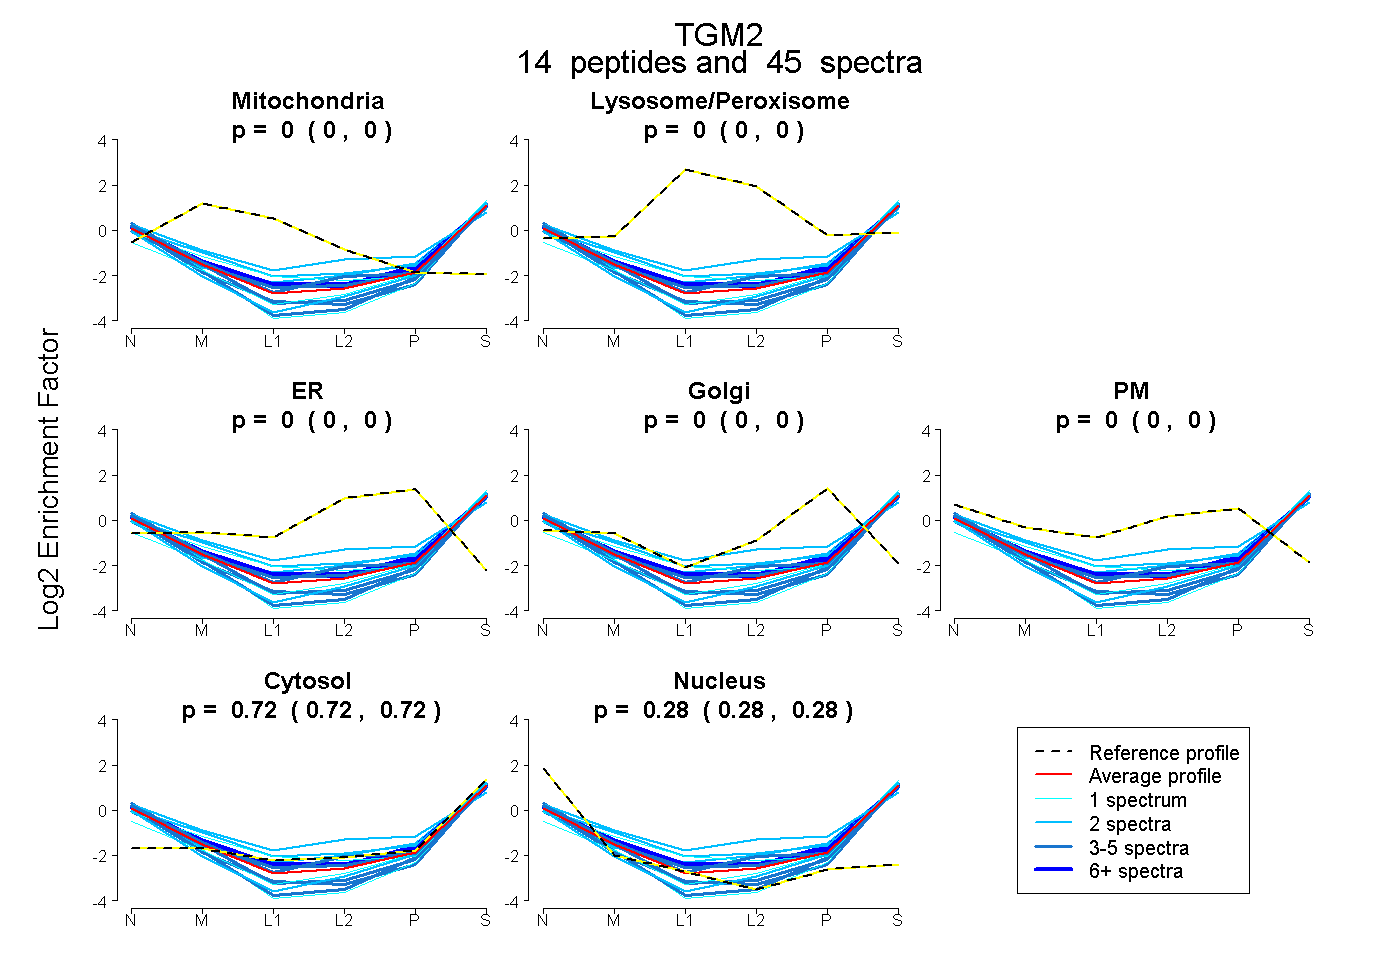
0.000 | 0.000
0.000 | 0.000
0.000 | 0.000
0.000 | 0.000
0.000 | 0.000
0.718 | 0.724
0.276 | 0.282
22peptides
spectra
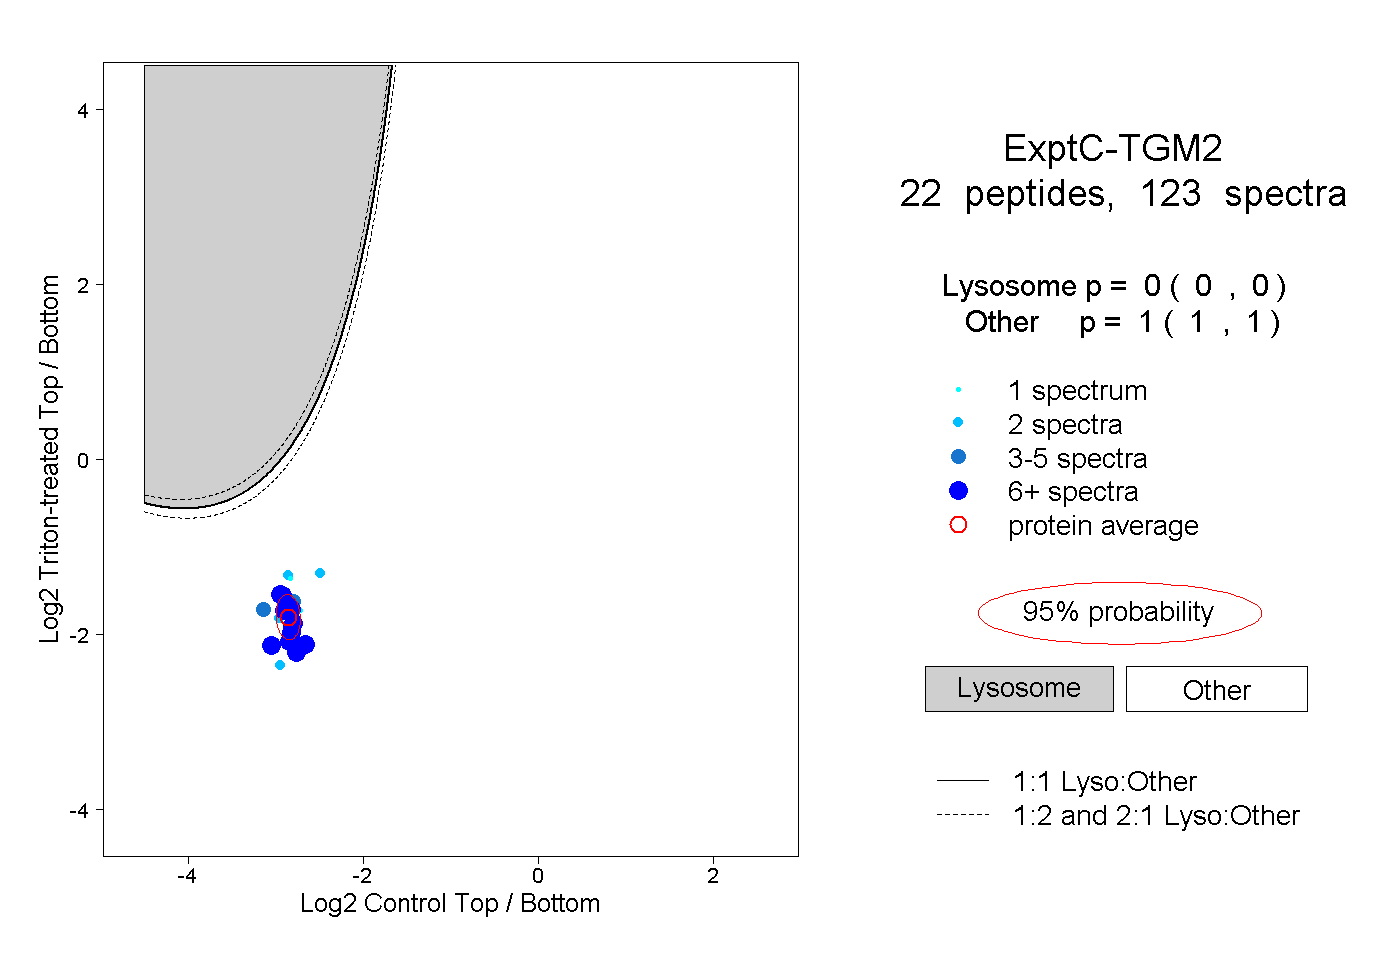
0.000 | 0.000
1.000 | 1.000
9peptides
spectra
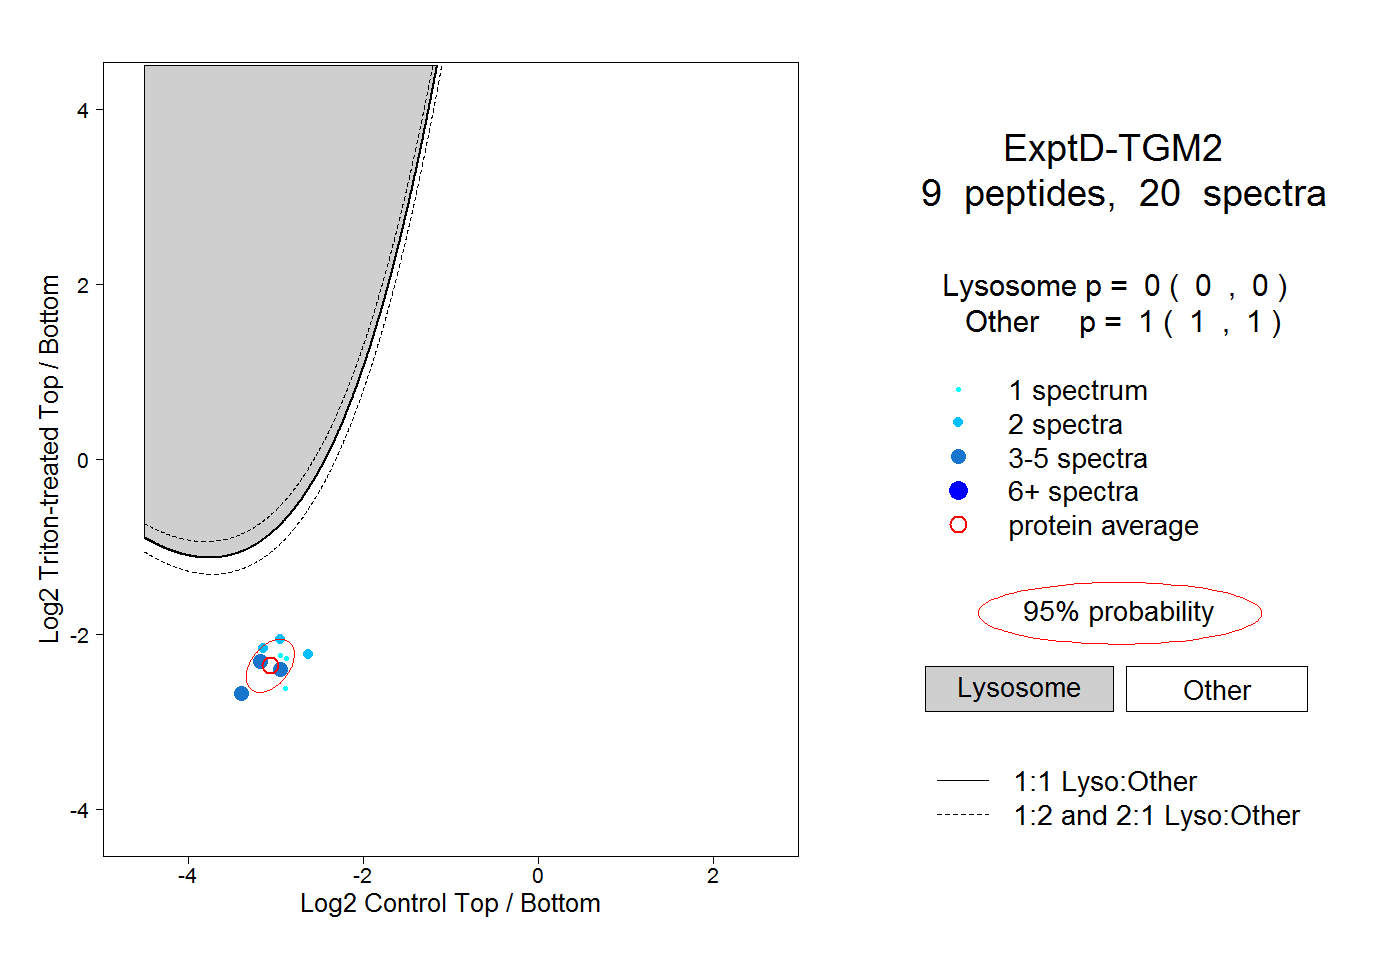
0.000 | 0.000
1.000 | 1.000