10
10peptides
spectra
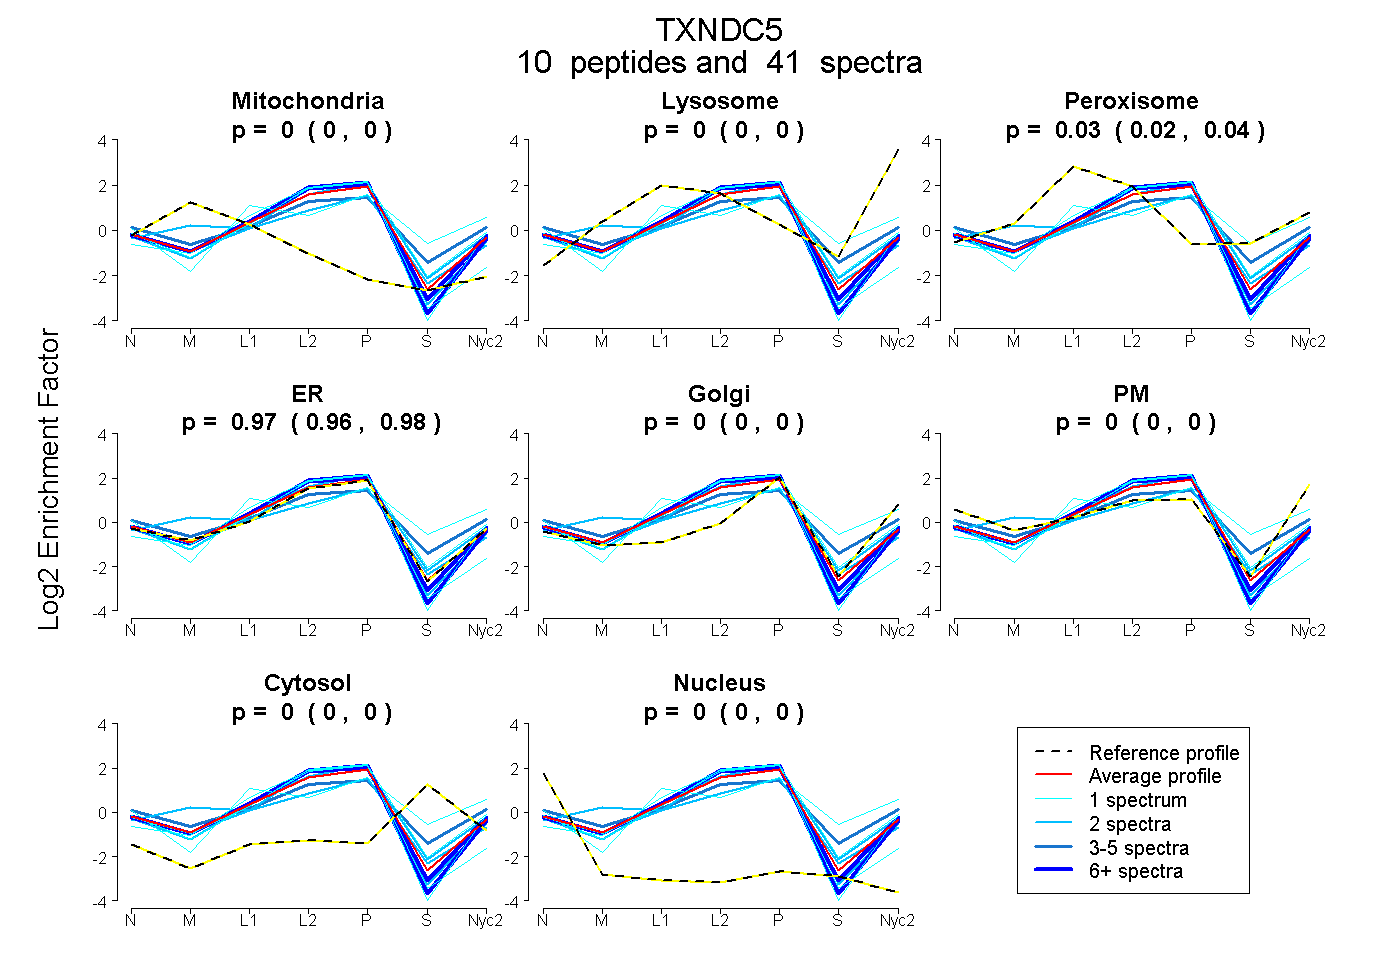
0.000 | 0.000
0.000 | 0.000
0.022 | 0.043
0.955 | 0.976
0.000 | 0.000
0.000 | 0.000
0.000 | 0.000
0.000 | 0.000
7peptides
spectra
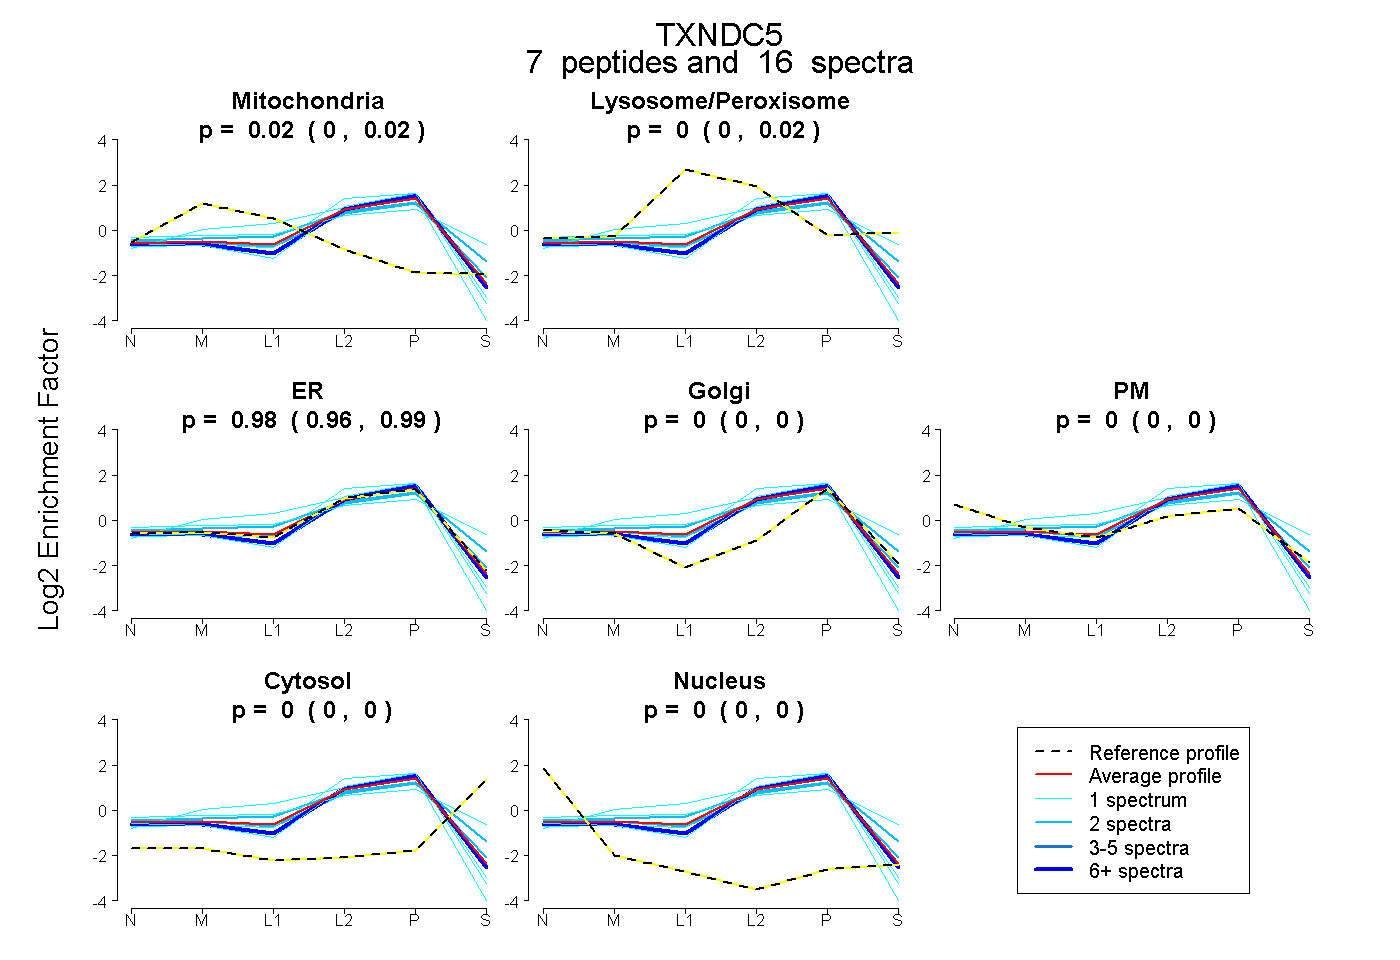
0.002 | 0.023
0.000 | 0.018
0.964 | 0.993
0.000 | 0.000
0.000 | 0.000
0.000 | 0.000
0.000 | 0.000