 9
9peptides
spectra
0.160 | 0.171
0.000 | 0.013
0.000 | 0.019
0.000 | 0.000
0.000 | 0.000
0.000 | 0.000
0.814 | 0.825
0.000 | 0.000
| Plot | Mito | Lyso | Perox | ER | Golgi | PM | Cytosol | Nucleus | |||||
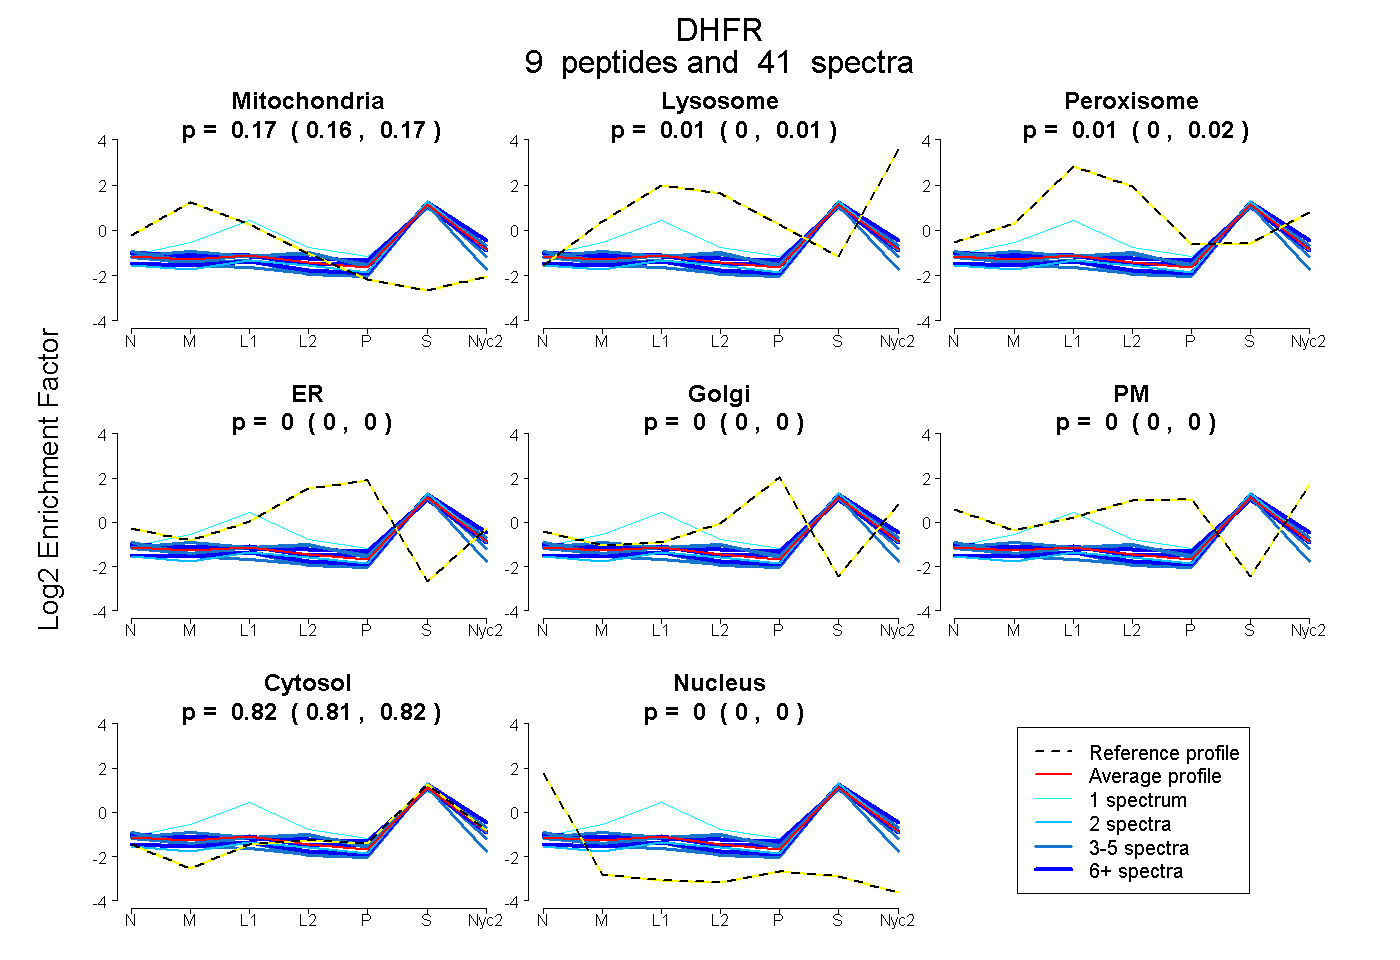
| Expt A |
9 peptides |
41 spectra |
|
0.166 0.160 | 0.171 |
0.006 0.000 | 0.013 |
0.007 0.000 | 0.019 |
0.000 0.000 | 0.000 |
0.000 0.000 | 0.000 |
0.000 0.000 | 0.000 |
0.820 0.814 | 0.825 |
0.000 0.000 | 0.000 |
| 3 spectra, EPPQGAHFLAK | 0.103 | 0.000 | 0.000 | 0.000 | 0.000 | 0.000 | 0.838 | 0.059 | ||
| 6 spectra, MTTTSSVEGK | 0.196 | 0.011 | 0.000 | 0.000 | 0.000 | 0.000 | 0.794 | 0.000 | ||
| 4 spectra, NGDLPWPLLR | 0.151 | 0.096 | 0.000 | 0.000 | 0.000 | 0.000 | 0.753 | 0.000 | ||
| 3 spectra, VRPLNCIVAVSQNMGIGK | 0.202 | 0.000 | 0.000 | 0.000 | 0.000 | 0.000 | 0.798 | 0.000 | ||
| 1 spectrum, FEVYEK | 0.114 | 0.000 | 0.321 | 0.000 | 0.000 | 0.000 | 0.564 | 0.000 | ||
| 11 spectra, INIVLSR | 0.166 | 0.019 | 0.026 | 0.000 | 0.000 | 0.000 | 0.789 | 0.000 | ||
| 8 spectra, QNLVIMGR | 0.097 | 0.010 | 0.000 | 0.000 | 0.000 | 0.000 | 0.893 | 0.000 | ||
| 3 spectra, LIEQPELASK | 0.142 | 0.000 | 0.000 | 0.000 | 0.000 | 0.000 | 0.858 | 0.000 | ||
| 2 spectra, TWFSIPEK | 0.091 | 0.000 | 0.000 | 0.000 | 0.000 | 0.000 | 0.909 | 0.000 |
| Plot | Mito | Lyso or Perox | ER | Golgi | PM | Cytosol | Nucleus | ||||||
| Expt B |
5 peptides |
17 spectra |
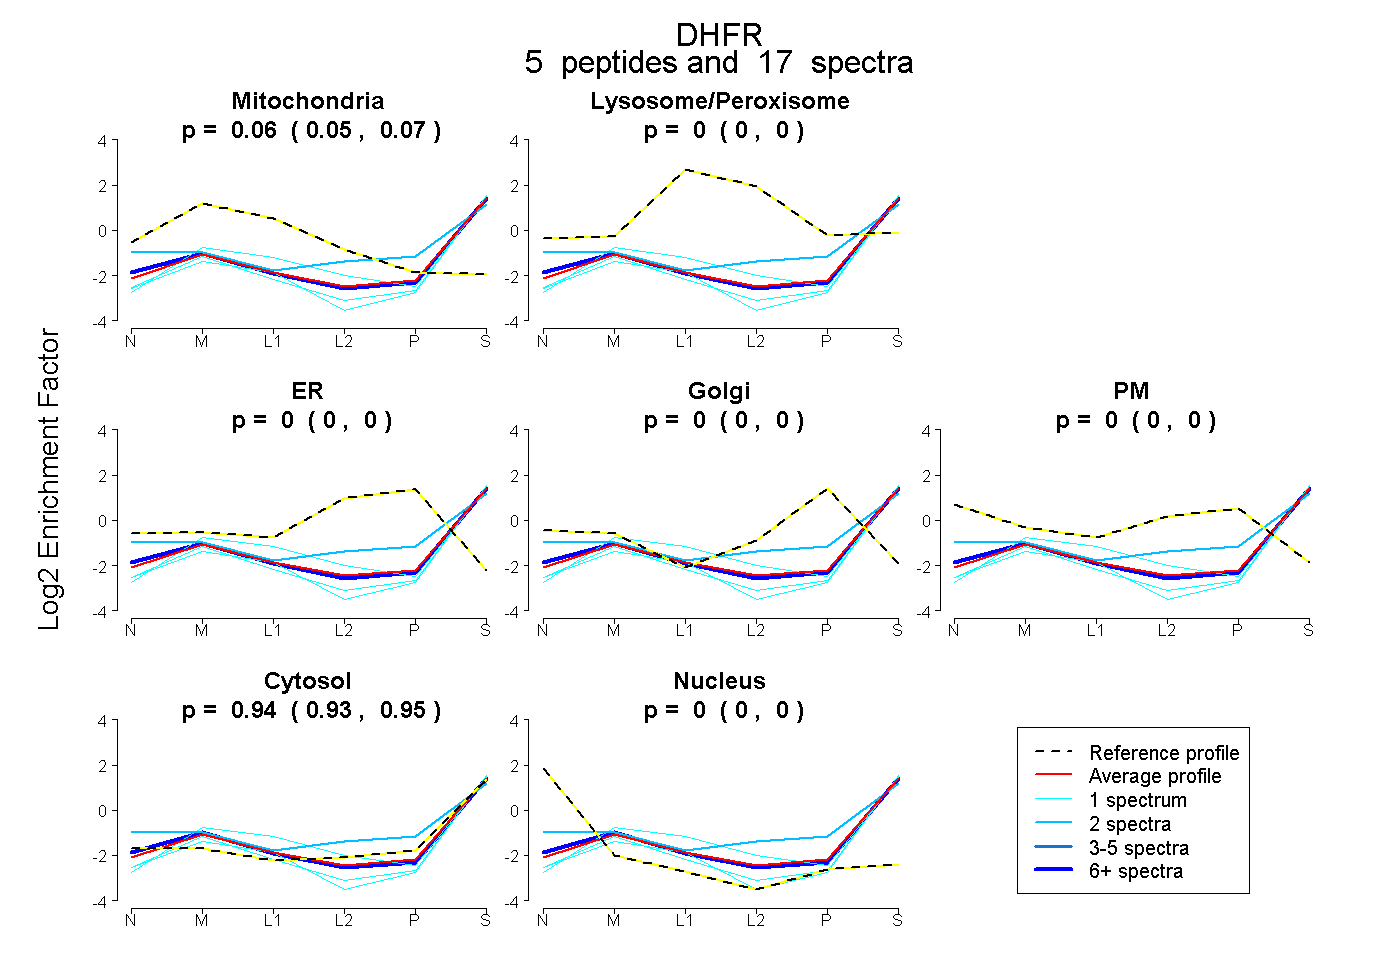 |
0.060 0.048 | 0.070 |
0.000 0.000 | 0.000 |
0.000 0.000 | 0.000 |
0.000 0.000 | 0.000 |
0.000 0.000 | 0.000 |
0.940 0.927 | 0.950 |
0.000 0.000 | 0.000 |
|||
| Plot | Lyso | Other | |||||||||||
| Expt C |
7 peptides |
52 spectra |
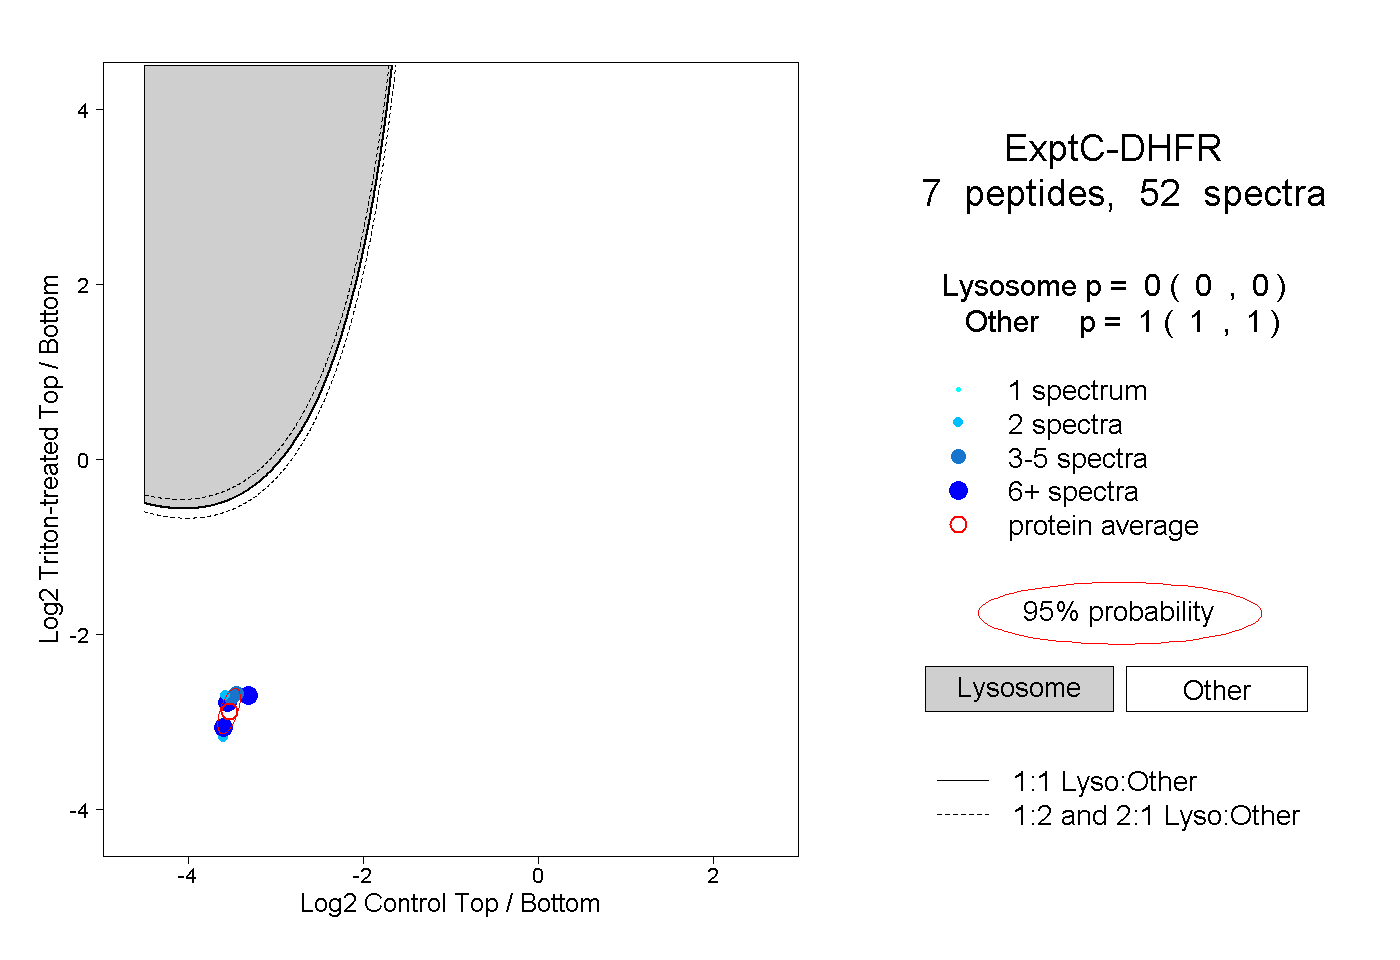 |
0.000 0.000 | 0.000 |
1.000 1.000 | 1.000 |
||||||||
| Plot | Lyso | Other | |||||||||||
| Expt D |
2 peptides |
2 spectra |
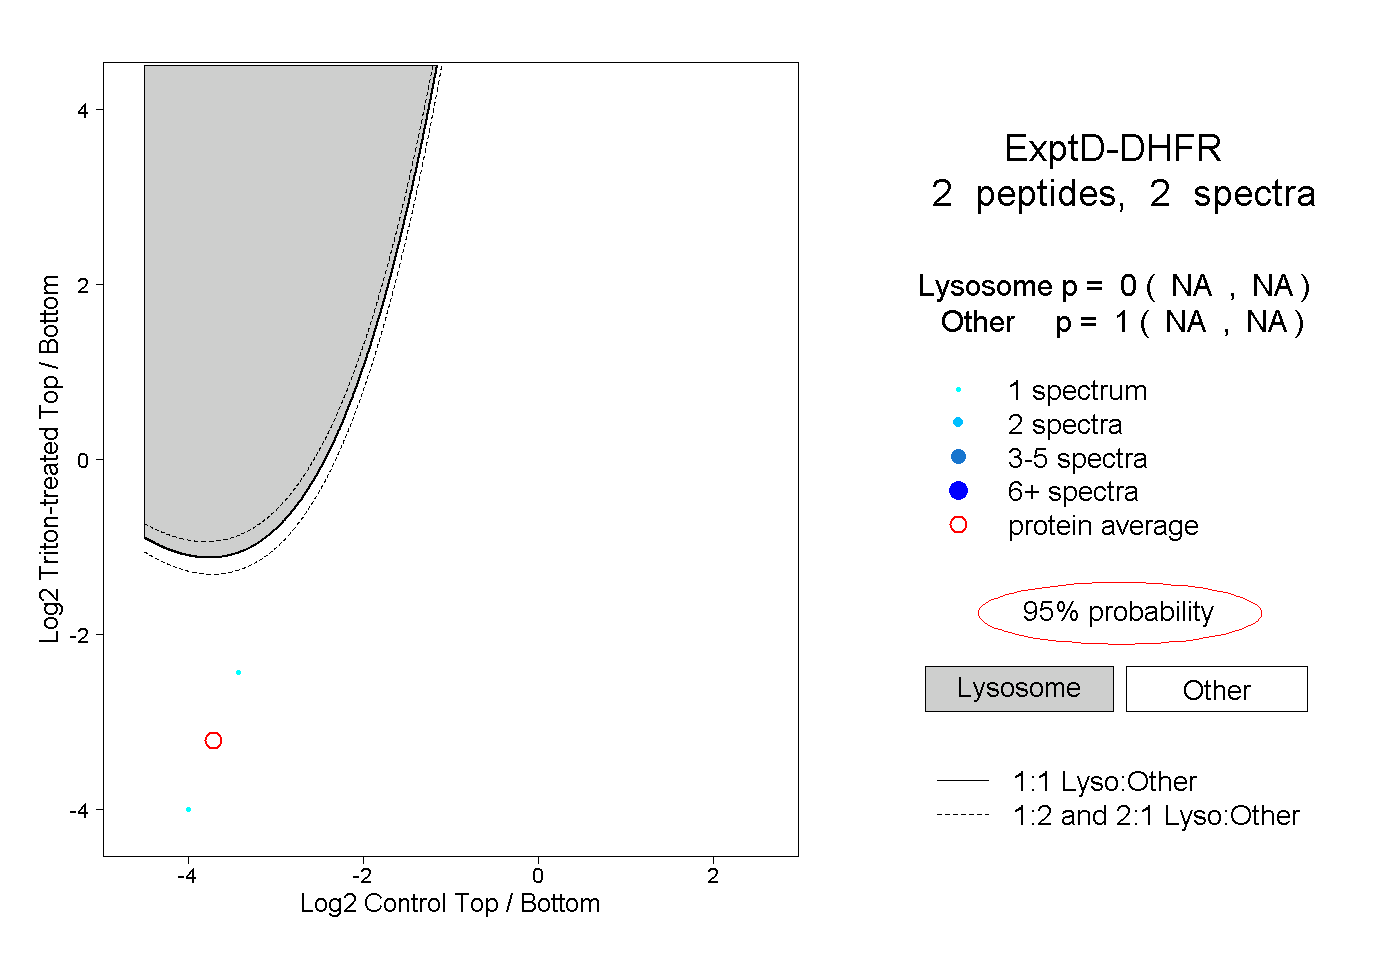 |
0.000 NA | NA |
1.000 NA | NA |