 1
1peptide
spectrum
NA | NA
NA | NA
NA | NA
NA | NA
NA | NA
NA | NA
NA | NA
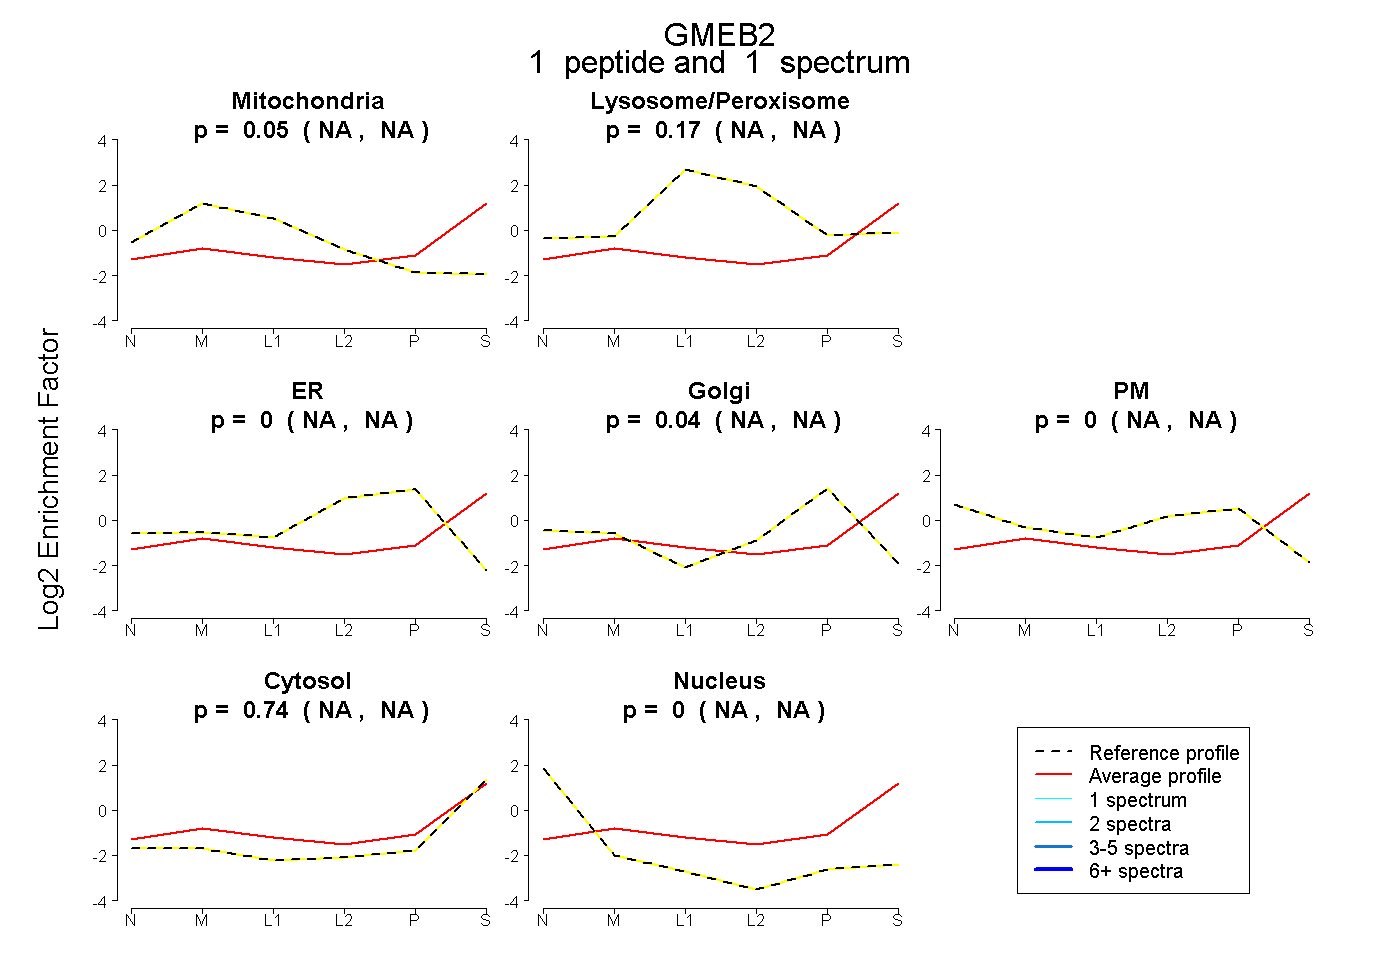
| Plot | Mito | Lyso or Perox | ER | Golgi | PM | Cytosol | Nucleus | ||||||
| Expt B |
1 peptide |
1 spectrum |
|
0.050 NA | NA |
0.168 NA | NA |
0.000 NA | NA |
0.042 NA | NA |
0.000 NA | NA |
0.740 NA | NA |
0.000 NA | NA |
| 1 spectrum, DLAALEQQCDEHR | 0.050 | 0.168 | 0.000 | 0.042 | 0.000 | 0.740 | 0.000 |