 10
10peptides
spectra
0.000 | 0.000
0.000 | 0.000
0.180 | 0.214
0.081 | 0.168
0.049 | 0.129
0.000 | 0.000
0.563 | 0.597
0.000 | 0.000
| Plot | Mito | Lyso | Perox | ER | Golgi | PM | Cytosol | Nucleus | |||||
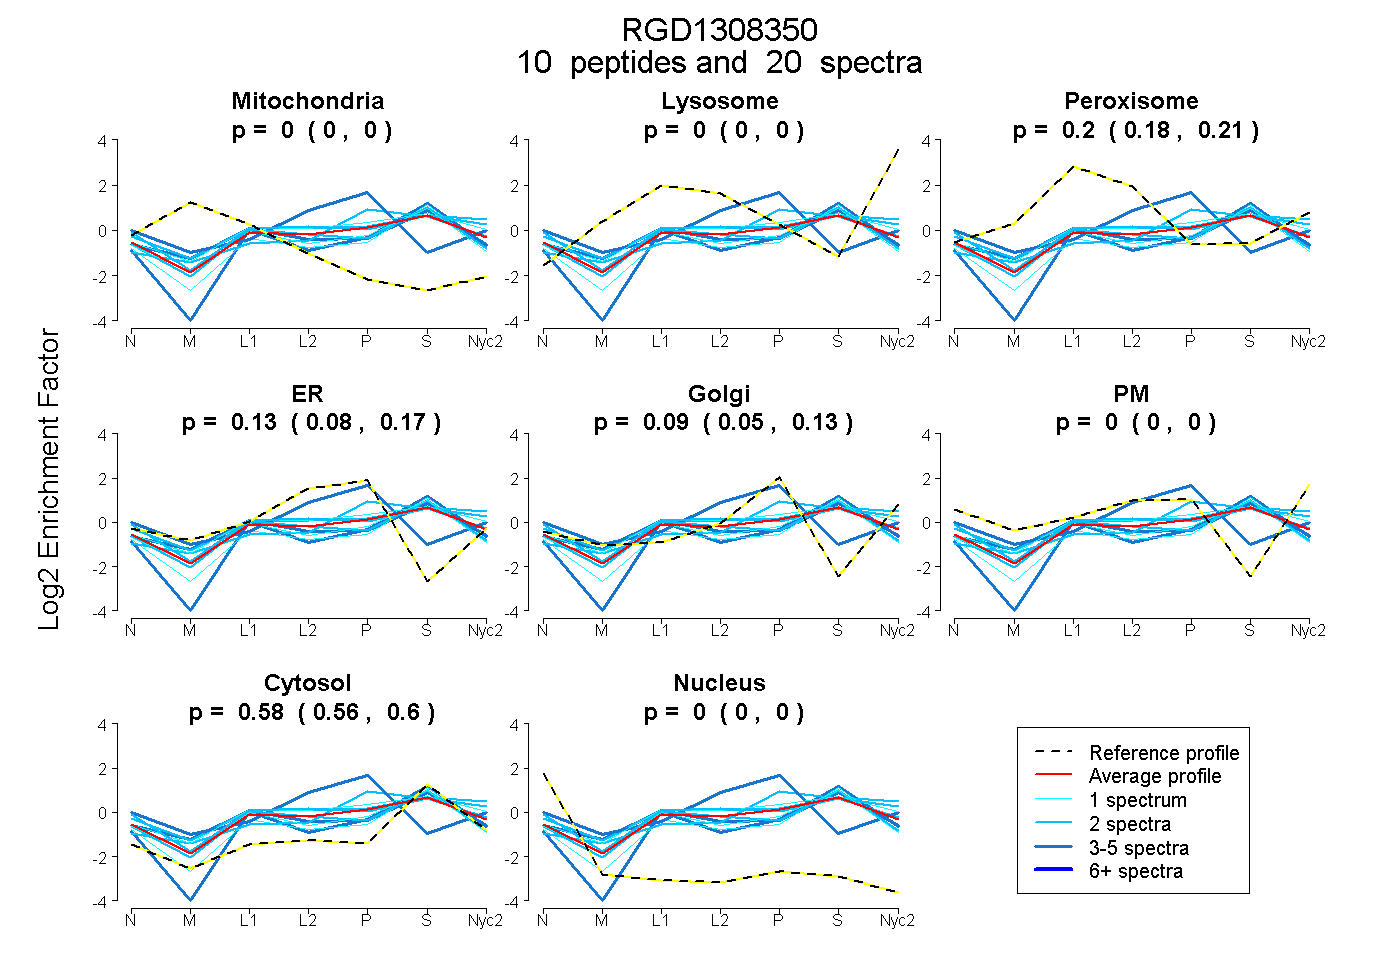
| Expt A |
10 peptides |
20 spectra |
|
0.000 0.000 | 0.000 |
0.000 0.000 | 0.000 |
0.199 0.180 | 0.214 |
0.128 0.081 | 0.168 |
0.092 0.049 | 0.129 |
0.000 0.000 | 0.000 |
0.581 0.563 | 0.597 |
0.000 0.000 | 0.000 |
| 2 spectra, FDVEVLK | 0.000 | 0.000 | 0.115 | 0.028 | 0.339 | 0.000 | 0.518 | 0.000 | ||
| 1 spectrum, LQASIEASR | 0.000 | 0.000 | 0.318 | 0.000 | 0.212 | 0.000 | 0.471 | 0.000 | ||
| 3 spectra, AEADSTSVRPEDATER | 0.000 | 0.000 | 0.055 | 0.084 | 0.000 | 0.000 | 0.860 | 0.000 | ||
| 1 spectrum, EDGGPPSLER | 0.000 | 0.000 | 0.109 | 0.081 | 0.000 | 0.000 | 0.810 | 0.000 | ||
| 3 spectra, AFTEDR | 0.002 | 0.000 | 0.293 | 0.059 | 0.027 | 0.000 | 0.619 | 0.000 | ||
| 2 spectra, VFDAIEQK | 0.000 | 0.000 | 0.210 | 0.000 | 0.000 | 0.265 | 0.525 | 0.000 | ||
| 2 spectra, DEDGKPVR | 0.000 | 0.046 | 0.204 | 0.000 | 0.014 | 0.243 | 0.492 | 0.000 | ||
| 3 spectra, HELENLR | 0.000 | 0.000 | 0.005 | 0.557 | 0.089 | 0.129 | 0.219 | 0.000 | ||
| 2 spectra, QQLAEEEAR | 0.000 | 0.000 | 0.226 | 0.101 | 0.000 | 0.000 | 0.674 | 0.000 | ||
| 1 spectrum, VTLLHHVLEEVEK | 0.000 | 0.000 | 0.186 | 0.124 | 0.000 | 0.000 | 0.689 | 0.000 |
| Plot | Mito | Lyso or Perox | ER | Golgi | PM | Cytosol | Nucleus | ||||||
| Expt B |
2 peptides |
5 spectra |
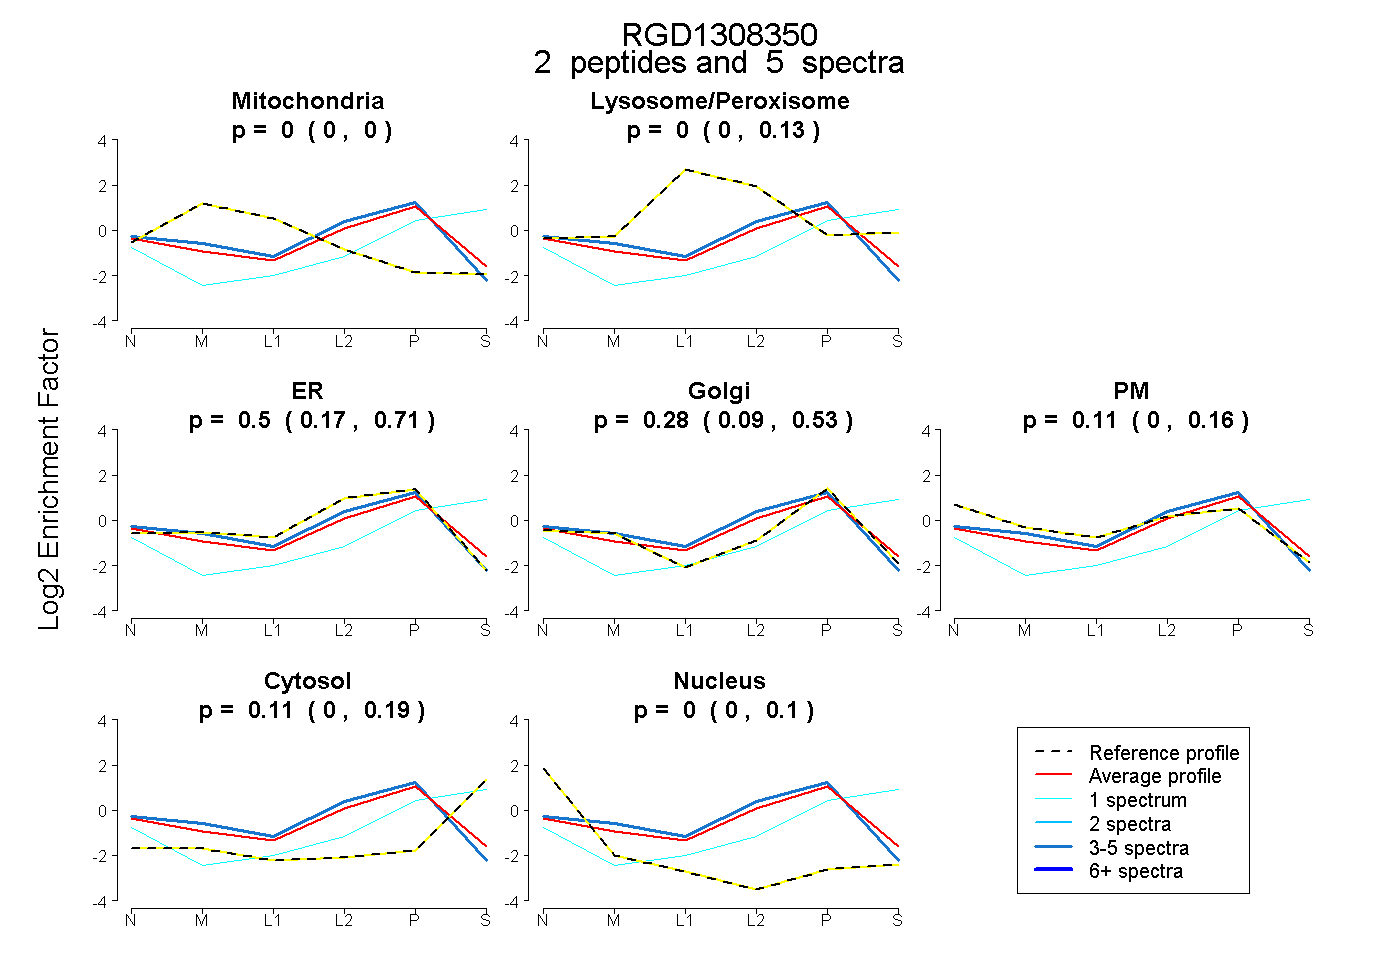 |
0.000 0.000 | 0.000 |
0.000 0.000 | 0.130 |
0.500 0.172 | 0.706 |
0.279 0.086 | 0.535 |
0.108 0.000 | 0.159 |
0.109 0.000 | 0.186 |
0.004 0.000 | 0.101 |
|||
| Plot | Lyso | Other | |||||||||||
| Expt C |
6 peptides |
8 spectra |
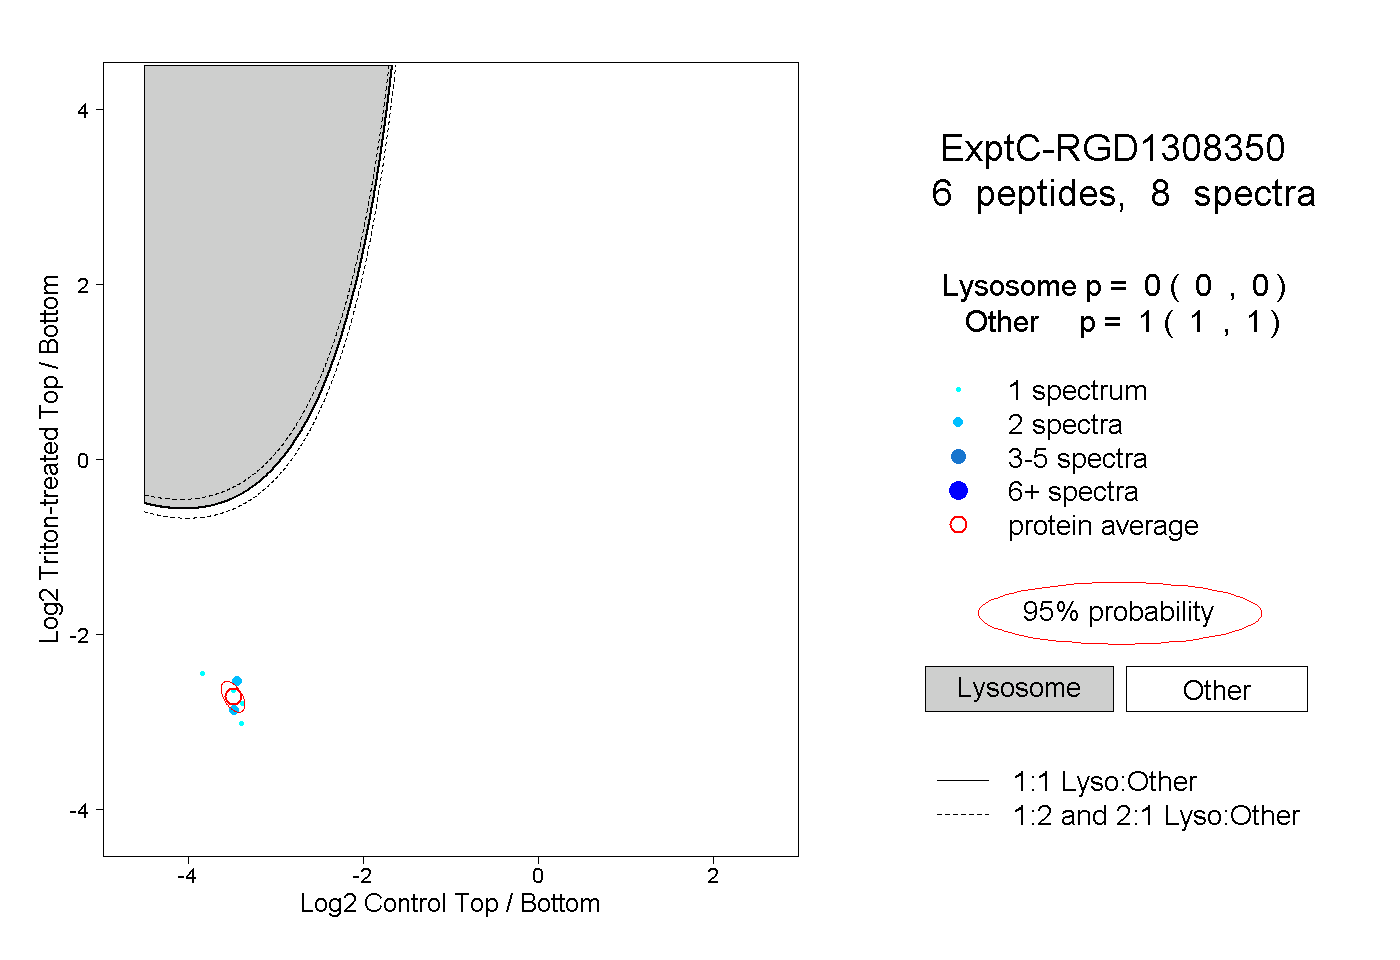 |
0.000 0.000 | 0.000 |
1.000 1.000 | 1.000 |
||||||||
| Plot | Lyso | Other | |||||||||||
| Expt D |
2 peptides |
3 spectra |
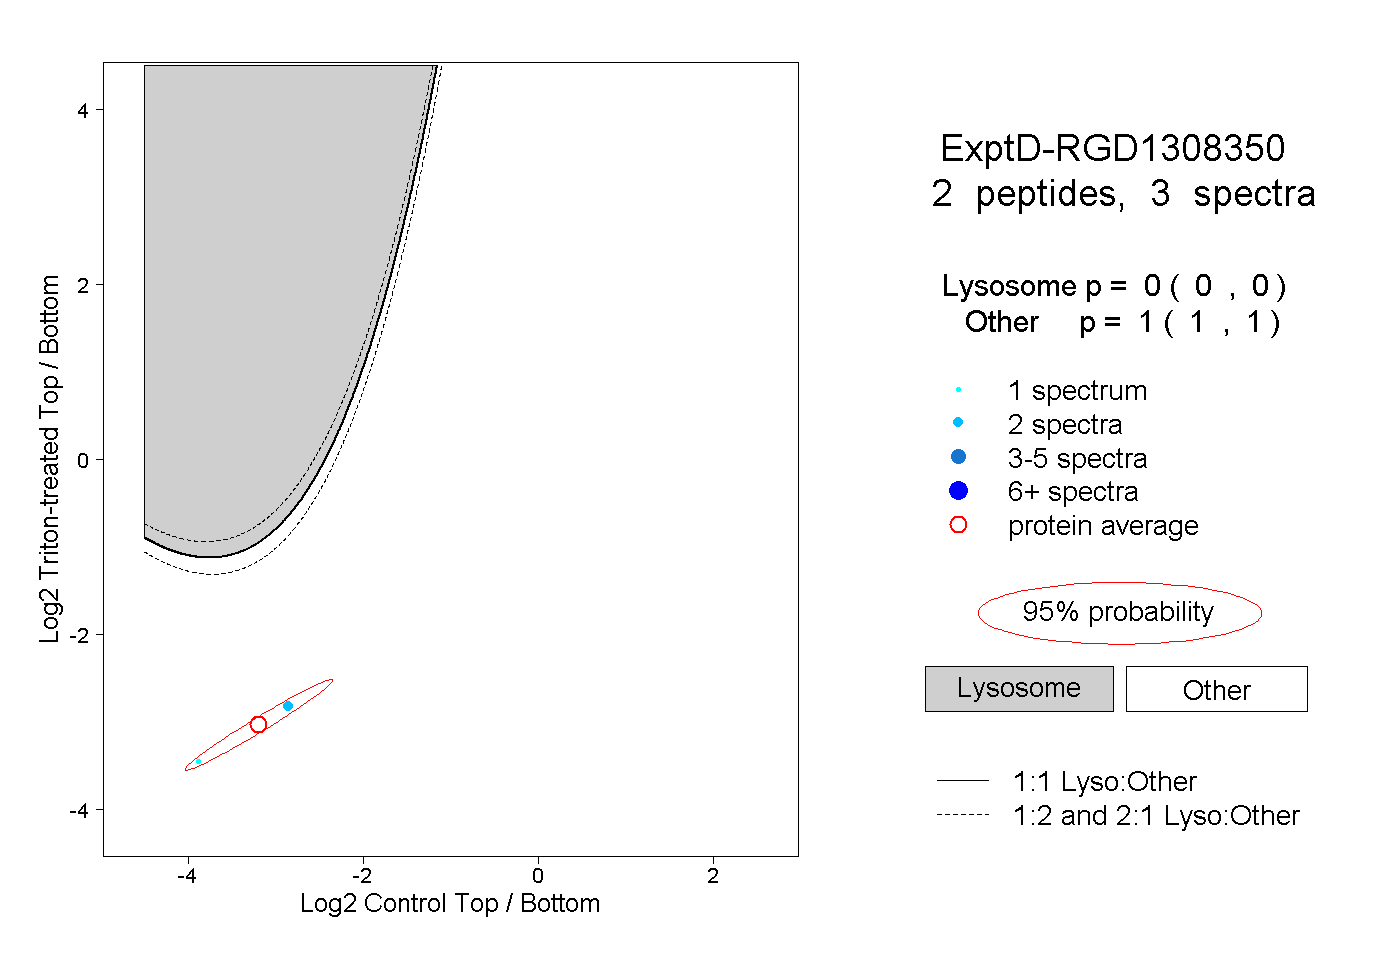 |
0.000 0.000 | 0.000 |
1.000 1.000 | 1.000 |