 22
22peptides
spectra
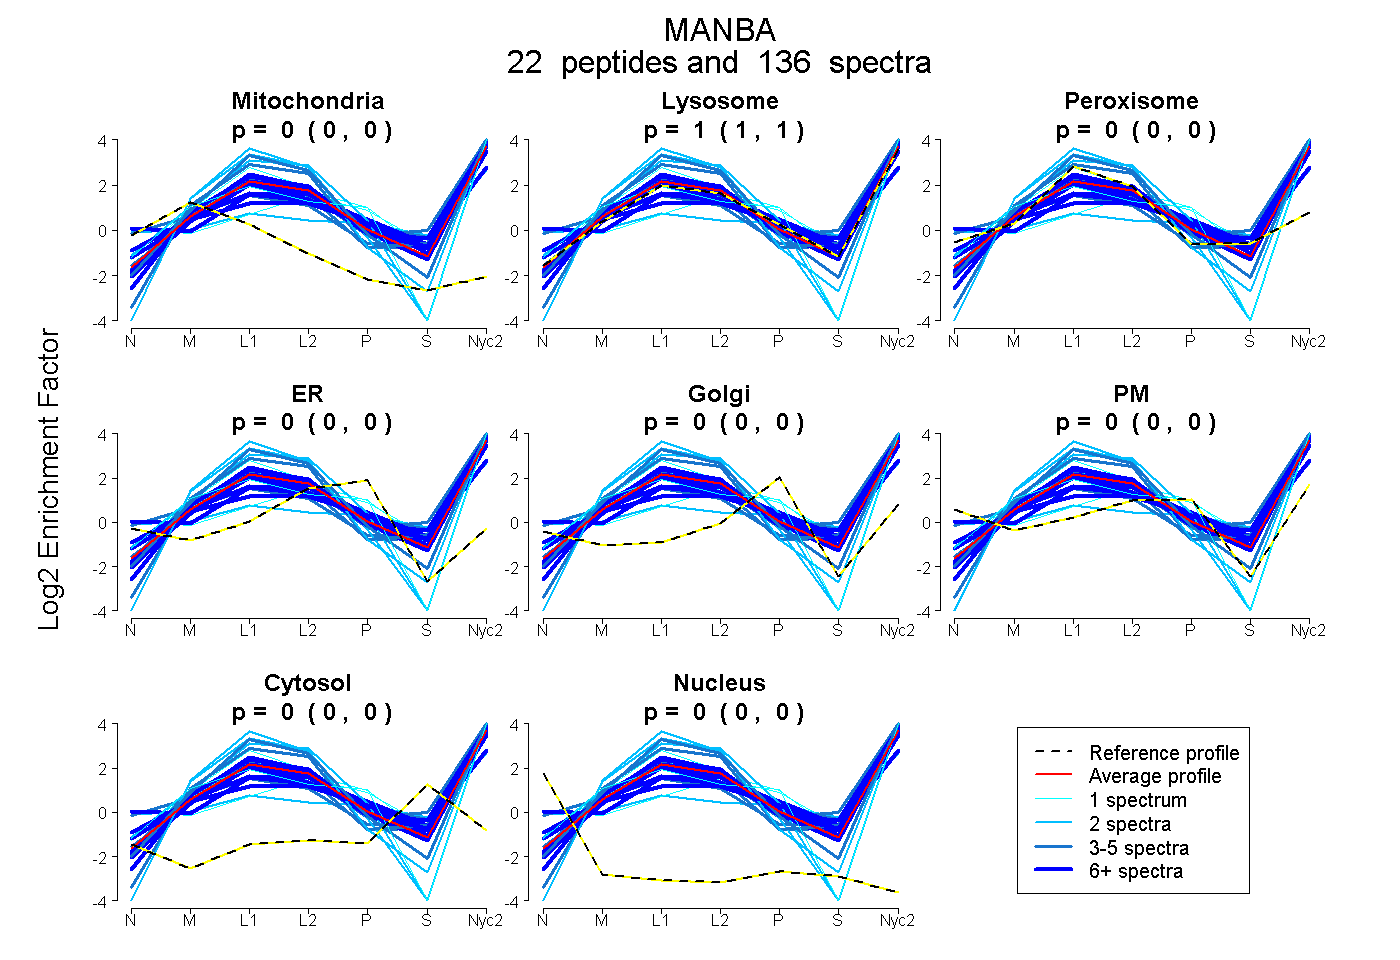
0.000 | 0.000
1.000 | 1.000
0.000 | 0.000
0.000 | 0.000
0.000 | 0.000
0.000 | 0.000
0.000 | 0.000
0.000 | 0.000
16peptides
spectra
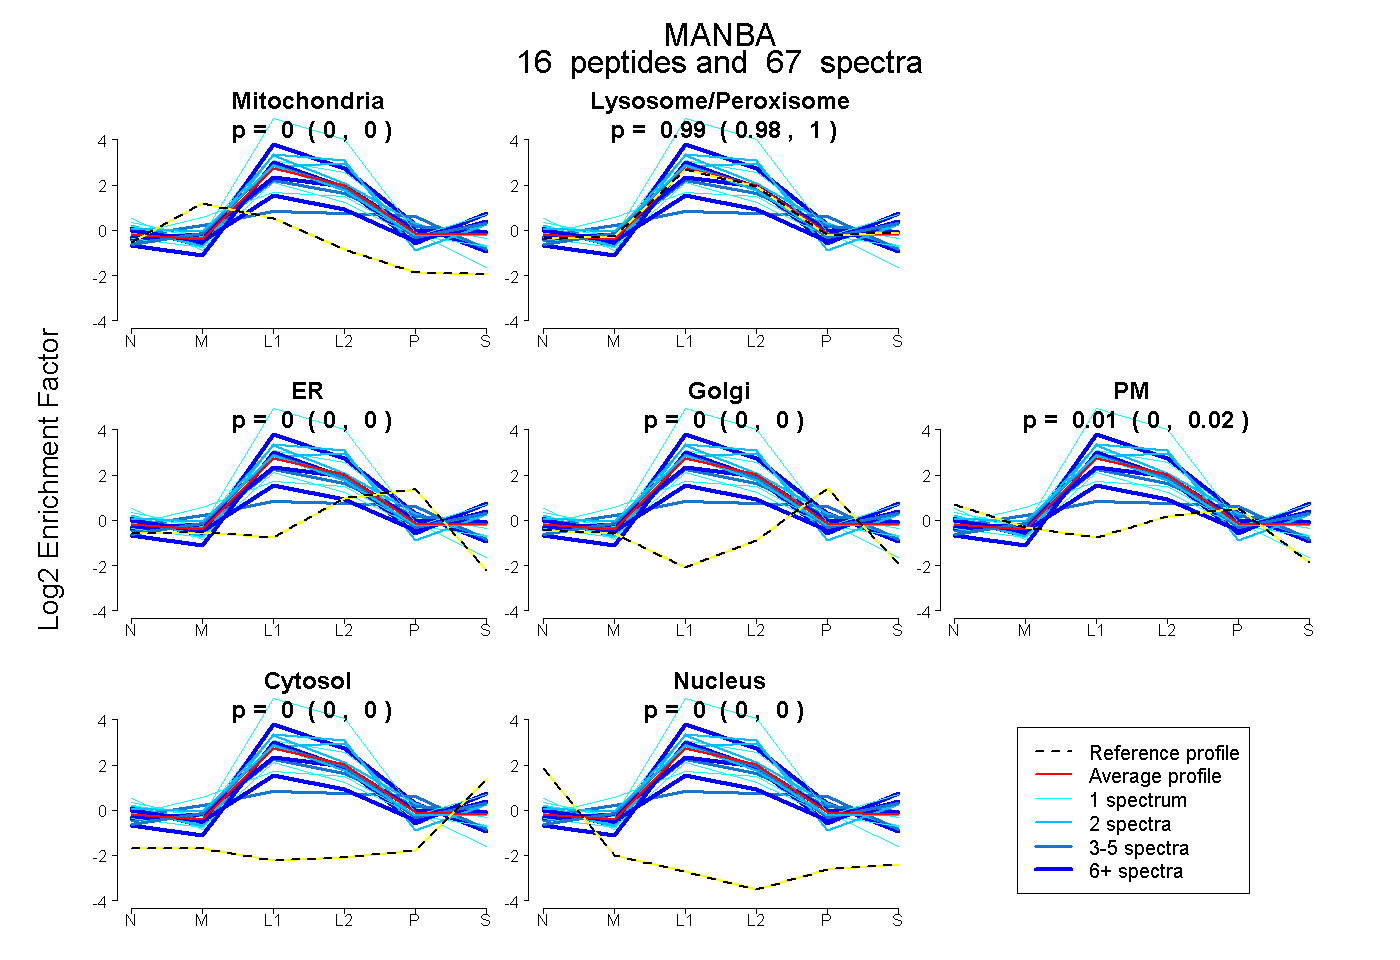
0.000 | 0.000
0.979 | 0.999
0.000 | 0.004
0.000 | 0.000
0.000 | 0.019
0.000 | 0.000
0.000 | 0.000
30peptides
spectra
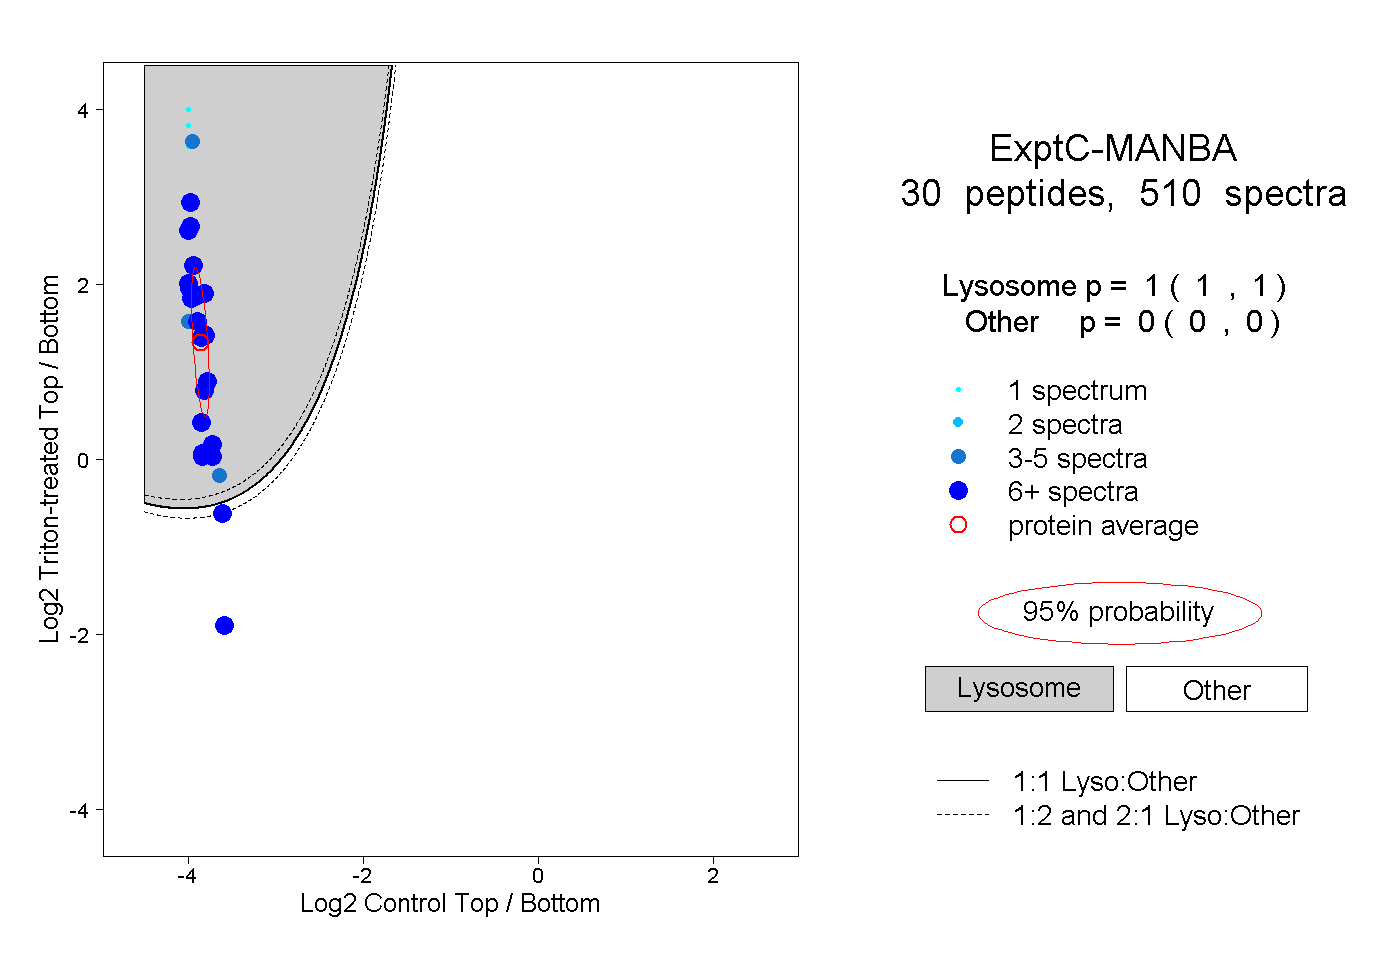
1.000 | 1.000
0.000 | 0.000
15peptides
spectra
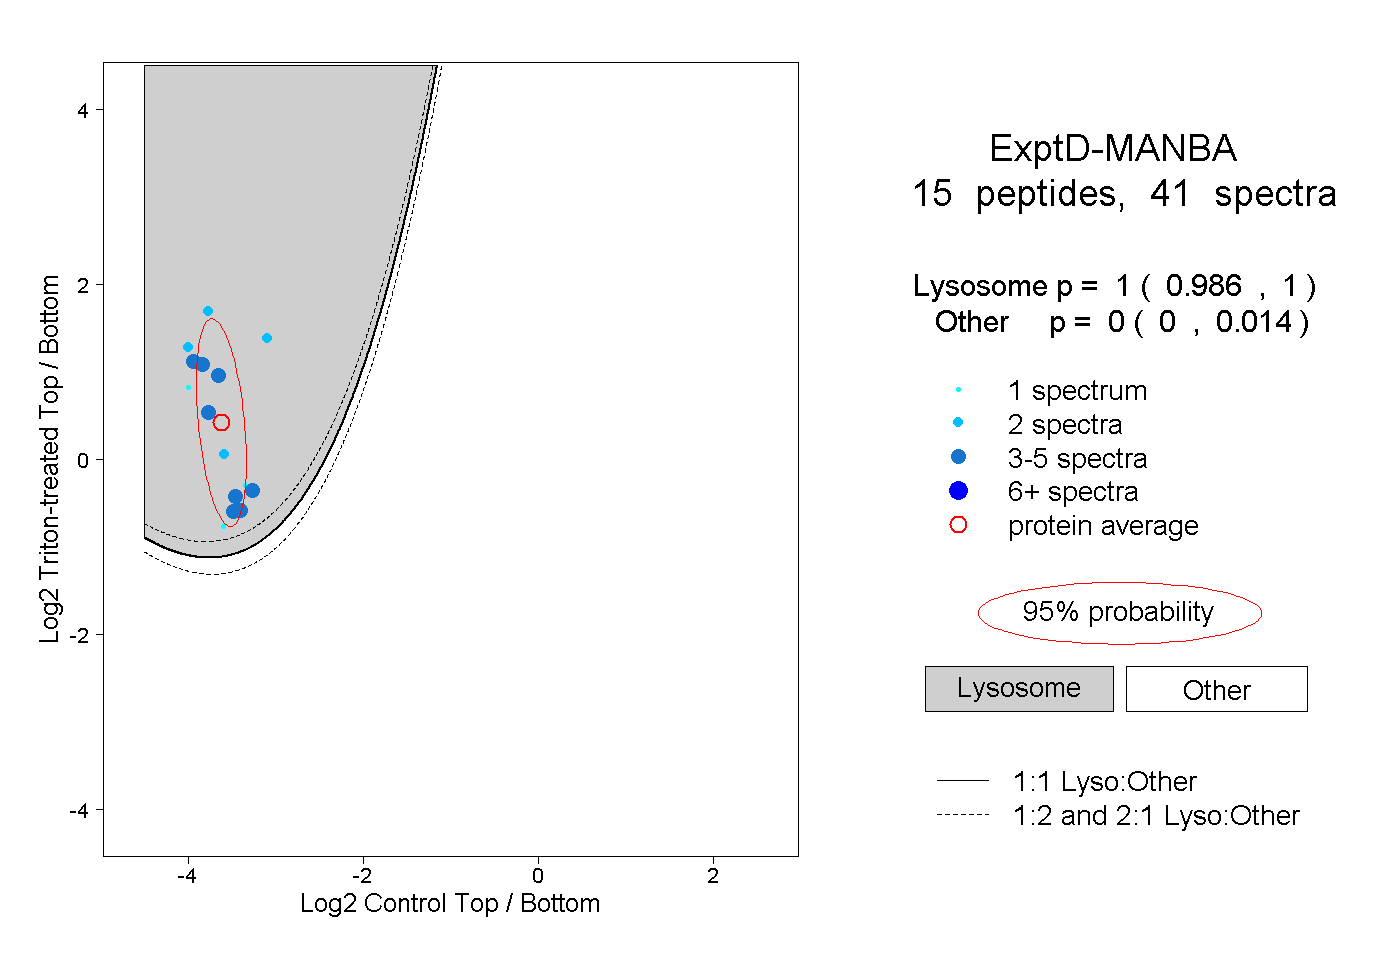
0.986 | 1.000
0.000 | 0.014