 9
9peptides
spectra
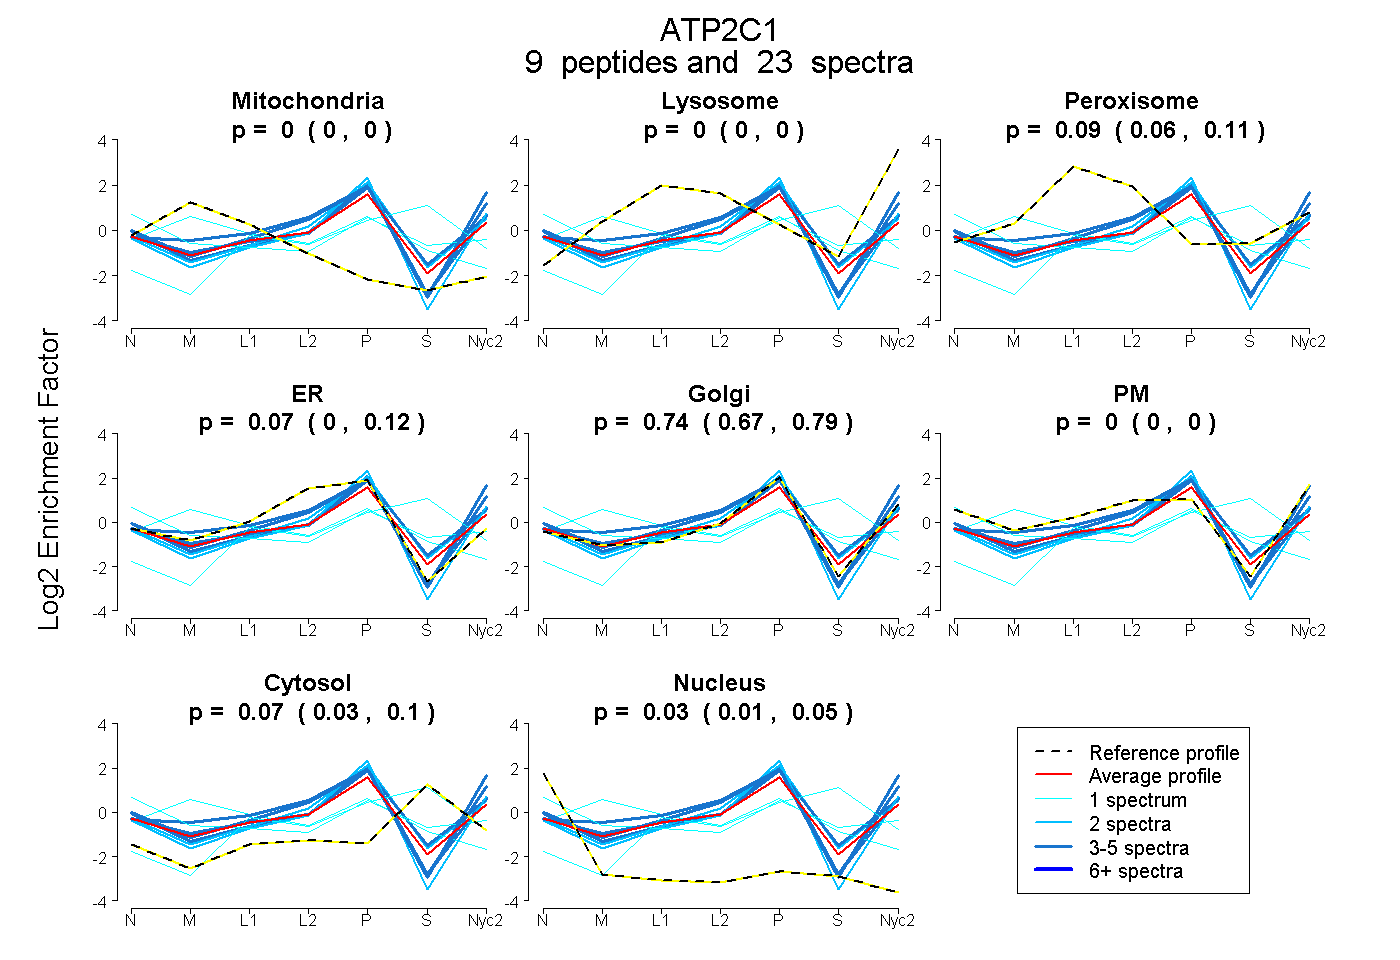
0.000 | 0.003
0.000 | 0.000
0.060 | 0.108
0.000 | 0.124
0.672 | 0.794
0.000 | 0.000
0.032 | 0.103
0.015 | 0.052
| Plot | Mito | Lyso | Perox | ER | Golgi | PM | Cytosol | Nucleus | |||||
| Expt A |
9 peptides |
23 spectra |
|
0.000 0.000 | 0.003 |
0.000 0.000 | 0.000 |
0.087 0.060 | 0.108 |
0.066 0.000 | 0.124 |
0.740 0.672 | 0.794 |
0.000 0.000 | 0.000 |
0.071 0.032 | 0.103 |
0.035 0.015 | 0.052 |
| 1 spectrum, MITGDSQETAIAIASR | 0.103 | 0.000 | 0.000 | 0.000 | 0.238 | 0.287 | 0.279 | 0.093 | ||
| 4 spectra, AQMGSAGLR | 0.000 | 0.000 | 0.000 | 0.069 | 0.867 | 0.037 | 0.000 | 0.026 | ||
| 2 spectra, GQTLALTQQQR | 0.000 | 0.000 | 0.000 | 0.042 | 0.949 | 0.000 | 0.000 | 0.009 | ||
| 3 spectra, LEHTLAR | 0.000 | 0.076 | 0.000 | 0.168 | 0.521 | 0.235 | 0.000 | 0.000 | ||
| 4 spectra, DLYQQEK | 0.000 | 0.000 | 0.090 | 0.000 | 0.821 | 0.000 | 0.089 | 0.000 | ||
| 1 spectrum, EAVTTLIASGVSIK | 0.403 | 0.000 | 0.000 | 0.332 | 0.060 | 0.000 | 0.205 | 0.000 | ||
| 5 spectra, SNIAFMGTLVR | 0.000 | 0.000 | 0.000 | 0.000 | 0.579 | 0.421 | 0.000 | 0.000 | ||
| 1 spectrum, VAVFYR | 0.000 | 0.014 | 0.011 | 0.207 | 0.000 | 0.000 | 0.768 | 0.000 | ||
| 2 spectra, DLVPGDTVCLSVGDR | 0.000 | 0.000 | 0.000 | 0.161 | 0.734 | 0.000 | 0.104 | 0.000 |
| Plot | Mito | Lyso or Perox | ER | Golgi | PM | Cytosol | Nucleus | ||||||
| Expt B |
2 peptides |
2 spectra |
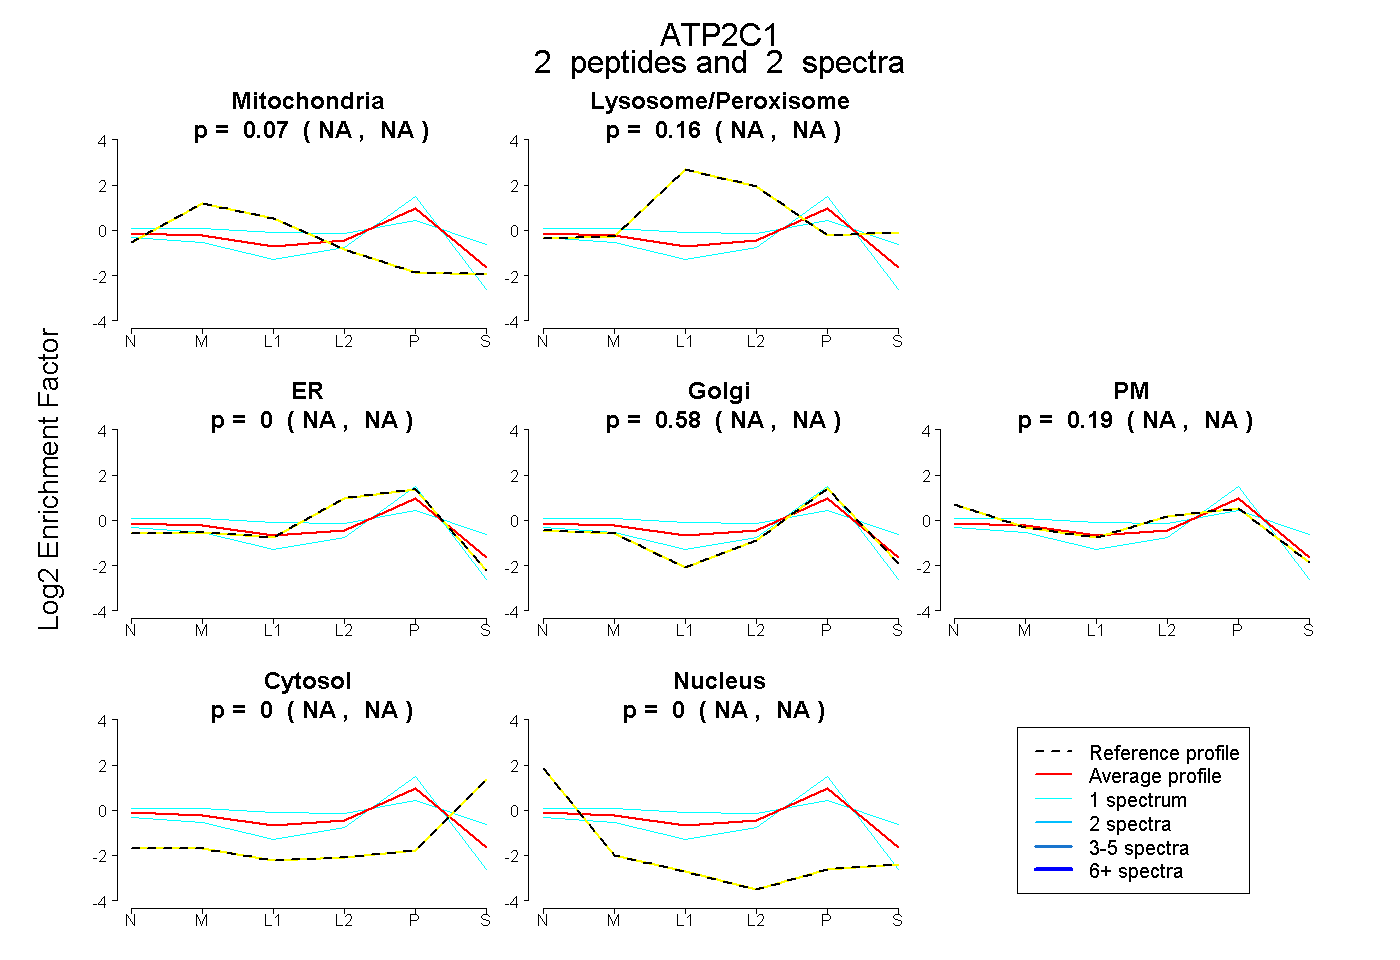 |
0.072 NA | NA |
0.160 NA | NA |
0.000 NA | NA |
0.582 NA | NA |
0.186 NA | NA |
0.000 NA | NA |
0.000 NA | NA |
|||
| Plot | Lyso | Other | |||||||||||
| Expt C |
11 peptides |
20 spectra |
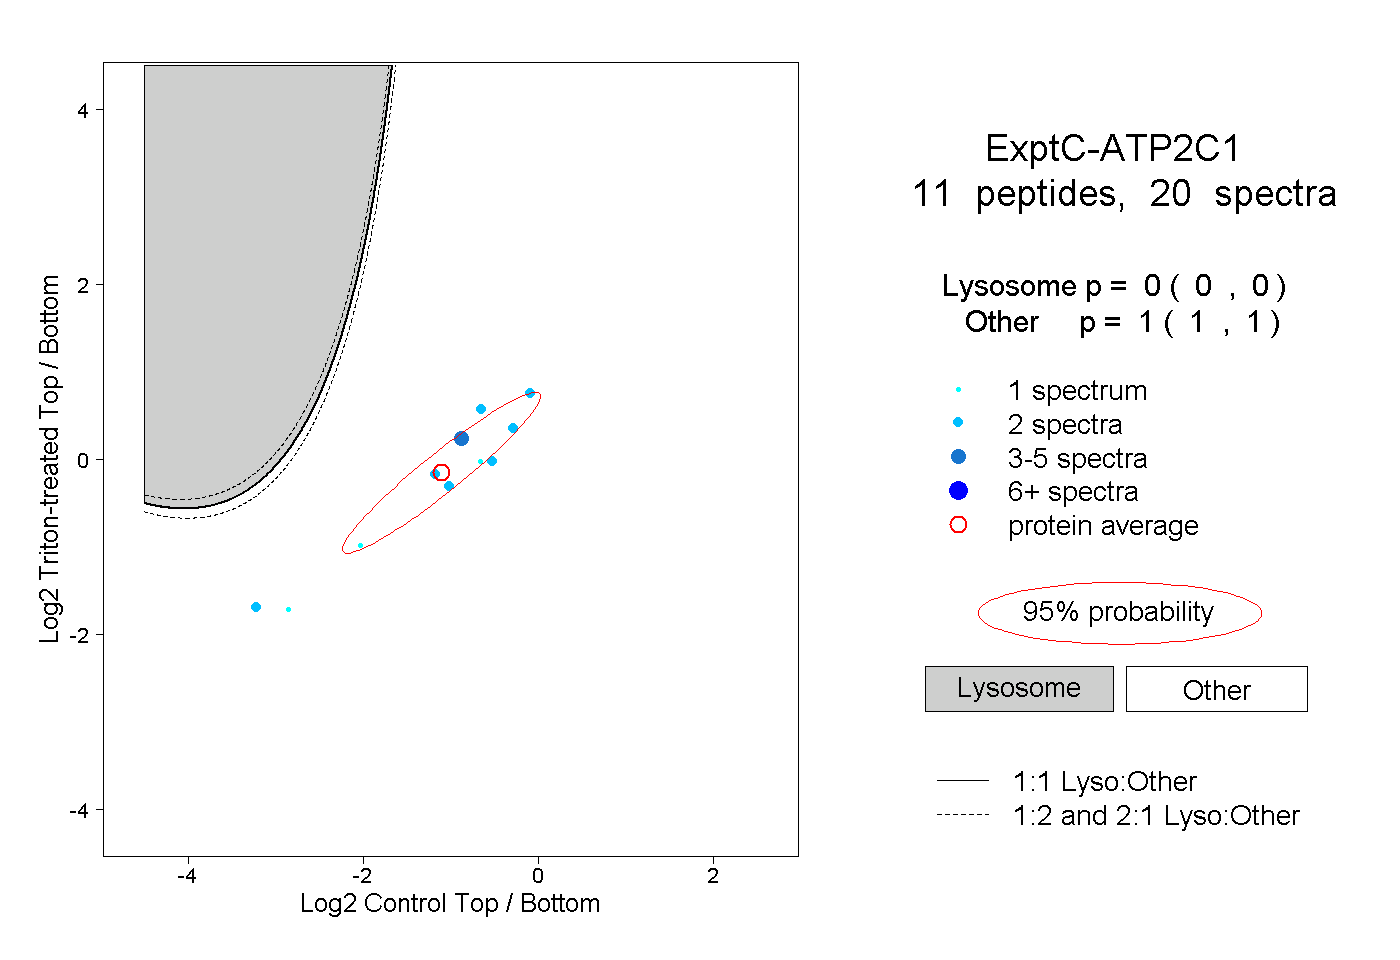 |
0.000 0.000 | 0.000 |
1.000 1.000 | 1.000 |