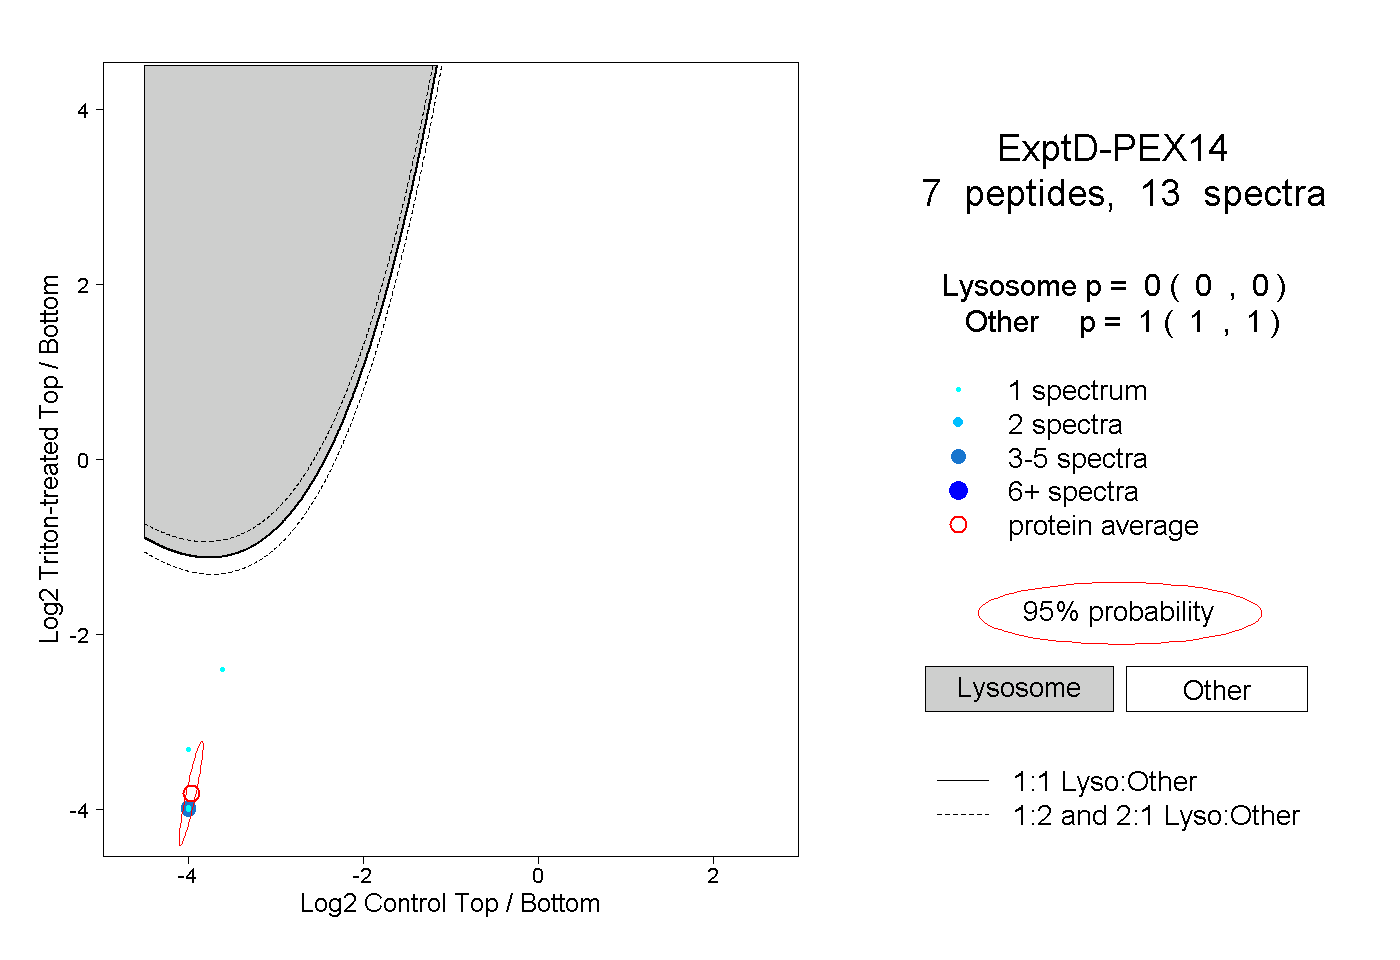
7
7peptides
spectra
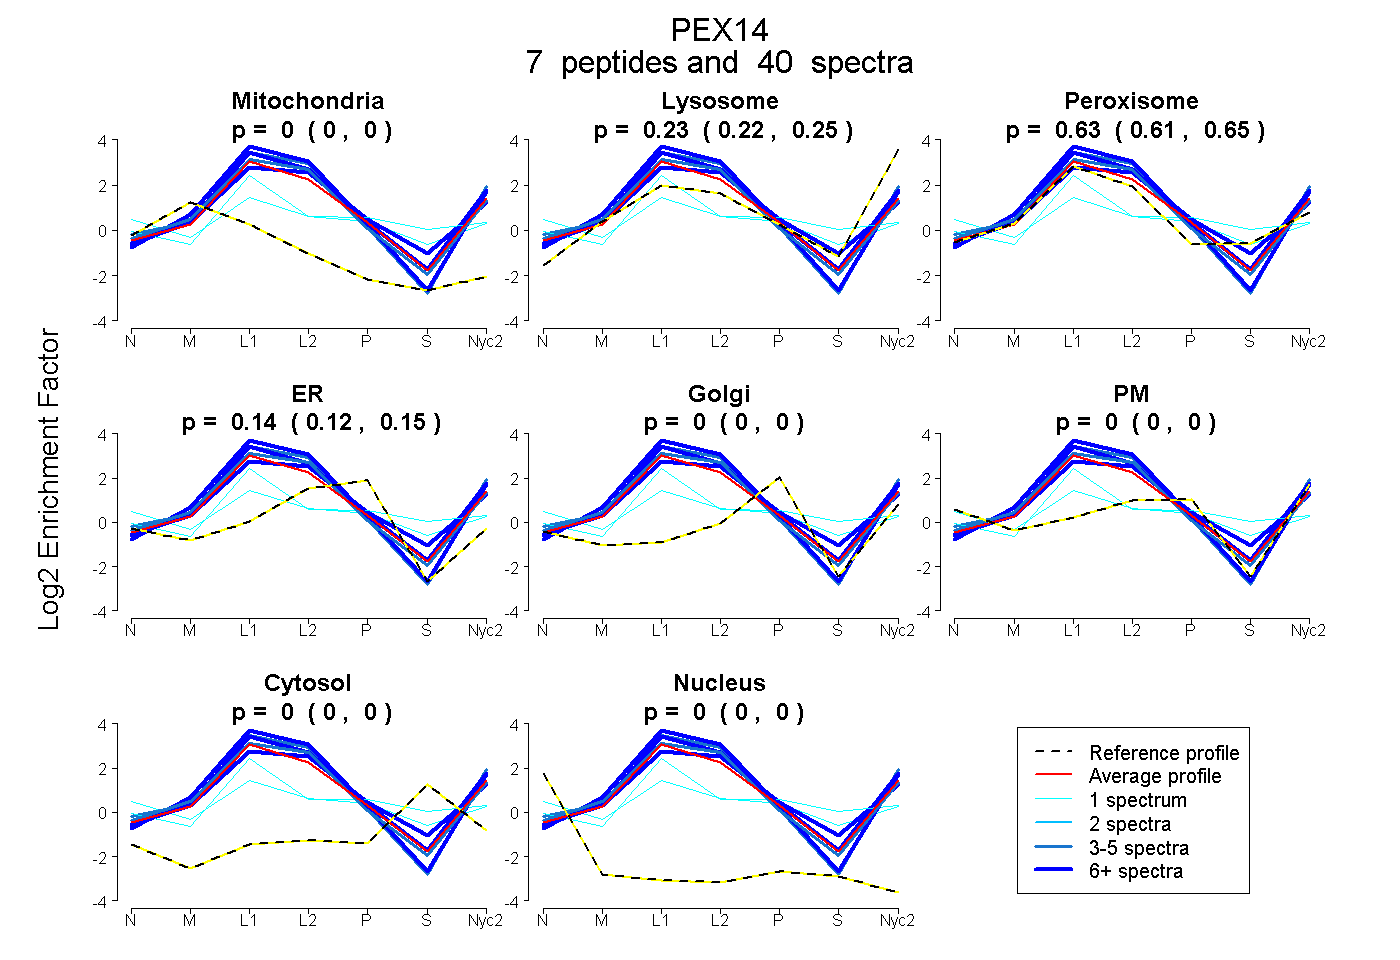
0.000 | 0.000
0.218 | 0.247
0.608 | 0.648
0.122 | 0.149
0.000 | 0.000
0.000 | 0.000
0.000 | 0.000
0.000 | 0.000
8peptides
spectra
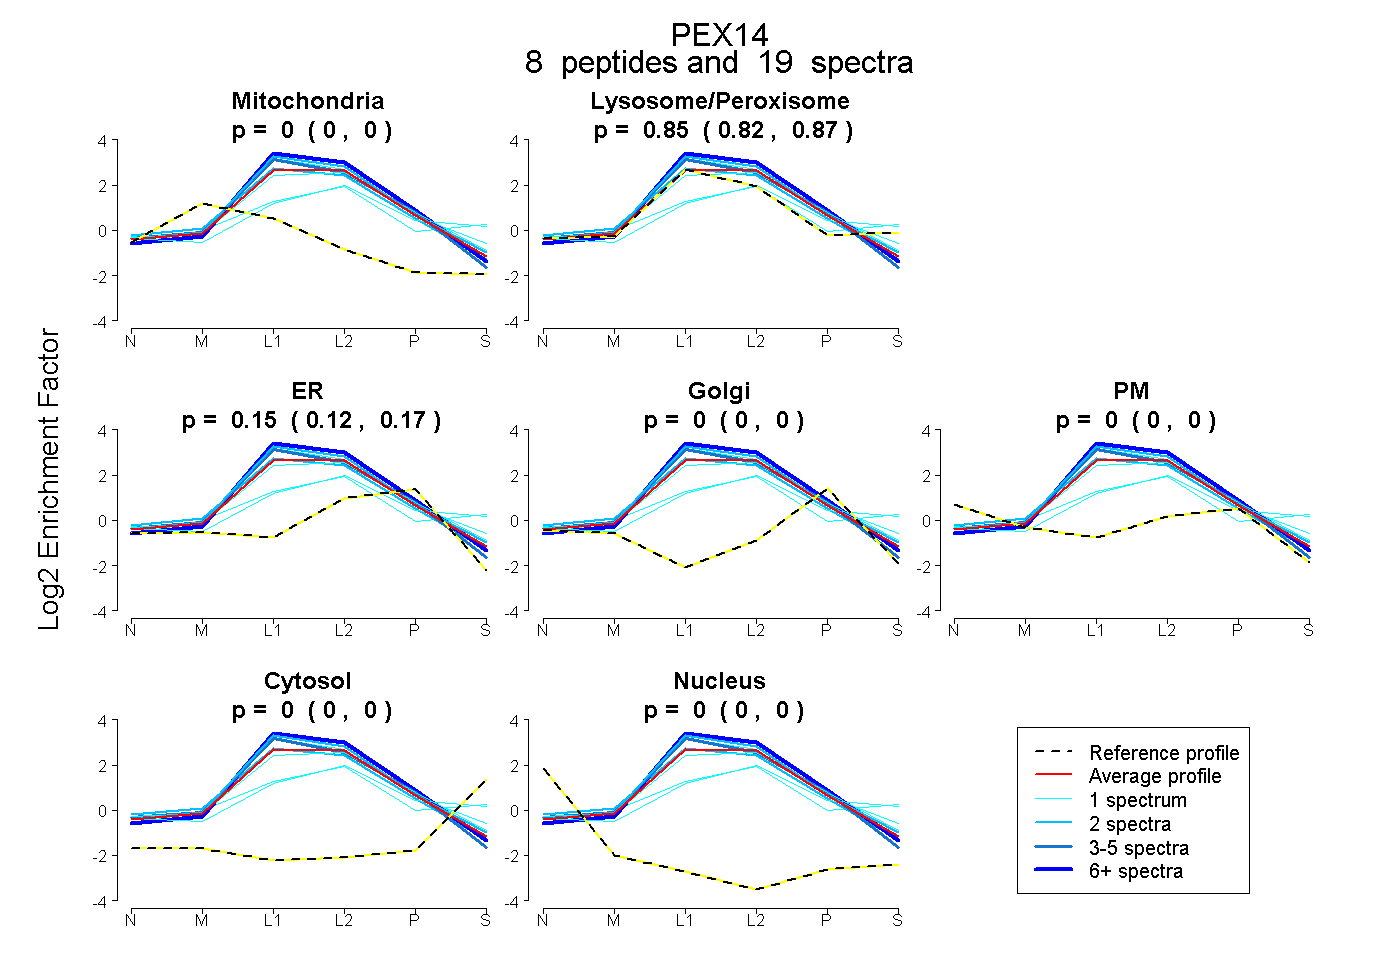
0.000 | 0.000
0.824 | 0.871
0.125 | 0.172
0.000 | 0.000
0.000 | 0.000
0.000 | 0.000
0.000 | 0.000