 8
8peptides
spectra
0.000 | 0.000
0.000 | 0.000
0.000 | 0.000
0.577 | 0.656
0.255 | 0.331
0.000 | 0.000
0.000 | 0.000
0.073 | 0.089
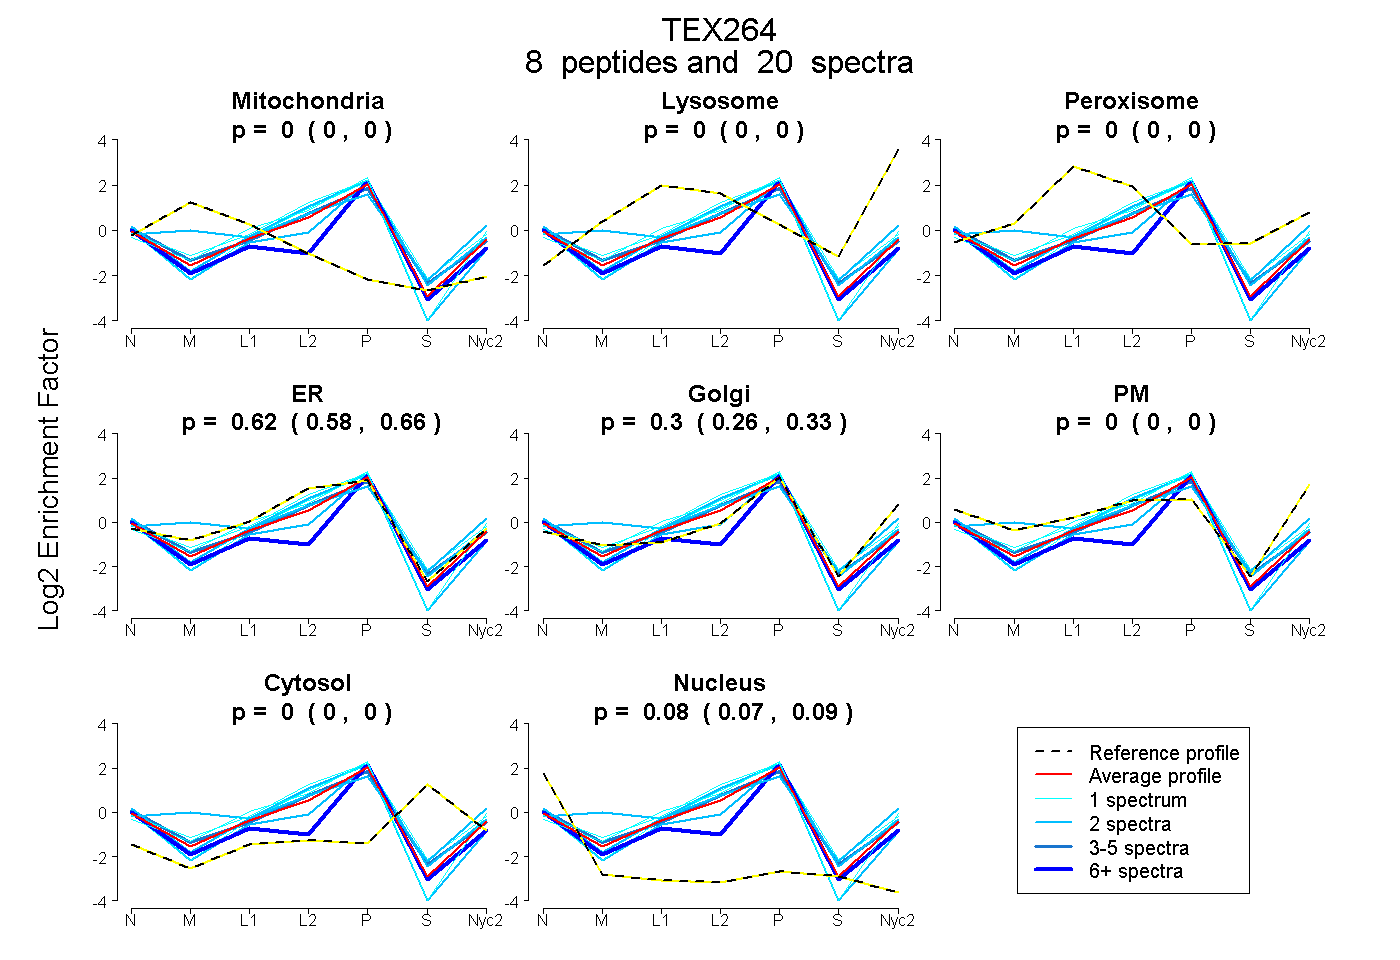
| Plot | Mito | Lyso | Perox | ER | Golgi | PM | Cytosol | Nucleus | |||||
| Expt A |
8 peptides |
20 spectra |
|
0.000 0.000 | 0.000 |
0.000 0.000 | 0.000 |
0.000 0.000 | 0.000 |
0.622 0.577 | 0.656 |
0.296 0.255 | 0.331 |
0.000 0.000 | 0.000 |
0.000 0.000 | 0.000 |
0.082 0.073 | 0.089 |
| 1 spectrum, LEIYQQDQIHFMCPLAR | 0.000 | 0.000 | 0.000 | 0.655 | 0.252 | 0.000 | 0.079 | 0.014 | ||
| 7 spectra, LIASPR | 0.000 | 0.000 | 0.000 | 0.144 | 0.666 | 0.000 | 0.000 | 0.190 | ||
| 2 spectra, ETSATPFSPGASNR | 0.000 | 0.000 | 0.000 | 0.900 | 0.000 | 0.000 | 0.000 | 0.100 | ||
| 4 spectra, AWDDGDNR | 0.000 | 0.000 | 0.000 | 0.687 | 0.211 | 0.000 | 0.022 | 0.081 | ||
| 1 spectrum, QGDFYVPEVK | 0.000 | 0.000 | 0.000 | 0.840 | 0.155 | 0.000 | 0.000 | 0.005 | ||
| 2 spectra, ELSTPER | 0.000 | 0.000 | 0.000 | 0.307 | 0.580 | 0.000 | 0.000 | 0.112 | ||
| 2 spectra, NITLAYK | 0.110 | 0.041 | 0.000 | 0.430 | 0.307 | 0.112 | 0.000 | 0.000 | ||
| 1 spectrum, VHPALDVYIK | 0.000 | 0.000 | 0.000 | 0.741 | 0.257 | 0.000 | 0.000 | 0.002 |
| Plot | Mito | Lyso or Perox | ER | Golgi | PM | Cytosol | Nucleus | ||||||
| Expt B |
2 peptides |
4 spectra |
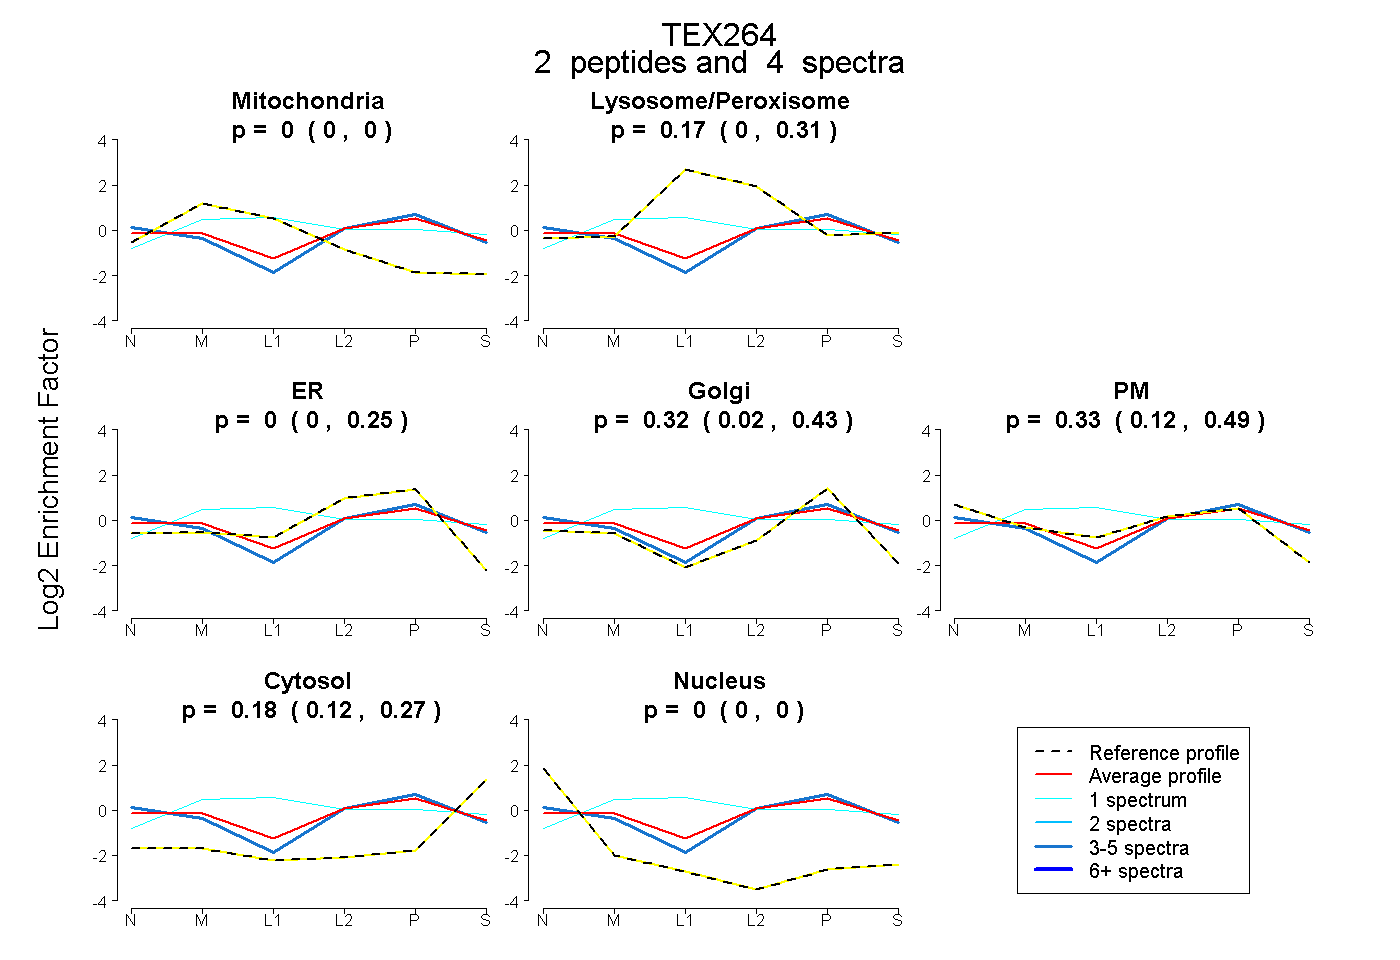 |
0.000 0.000 | 0.000 |
0.166 0.000 | 0.306 |
0.000 0.000 | 0.252 |
0.321 0.025 | 0.434 |
0.332 0.116 | 0.494 |
0.180 0.119 | 0.270 |
0.000 0.000 | 0.000 |
|||
| Plot | Lyso | Other | |||||||||||
| Expt C |
8 peptides |
22 spectra |
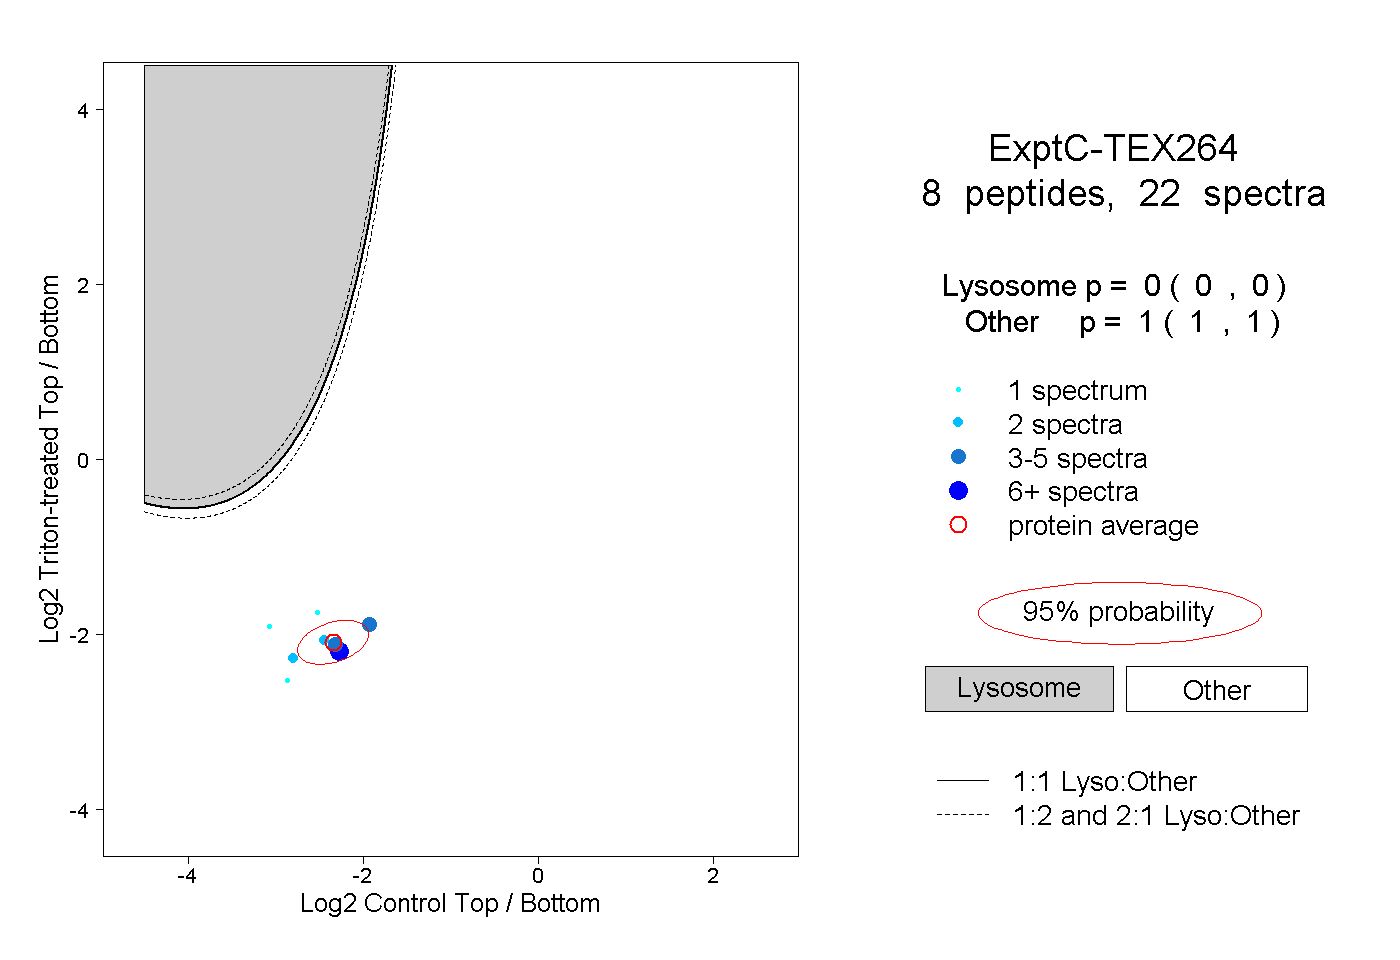 |
0.000 0.000 | 0.000 |
1.000 1.000 | 1.000 |
||||||||
| Plot | Lyso | Other | |||||||||||
| Expt D |
1 peptide |
1 spectrum |
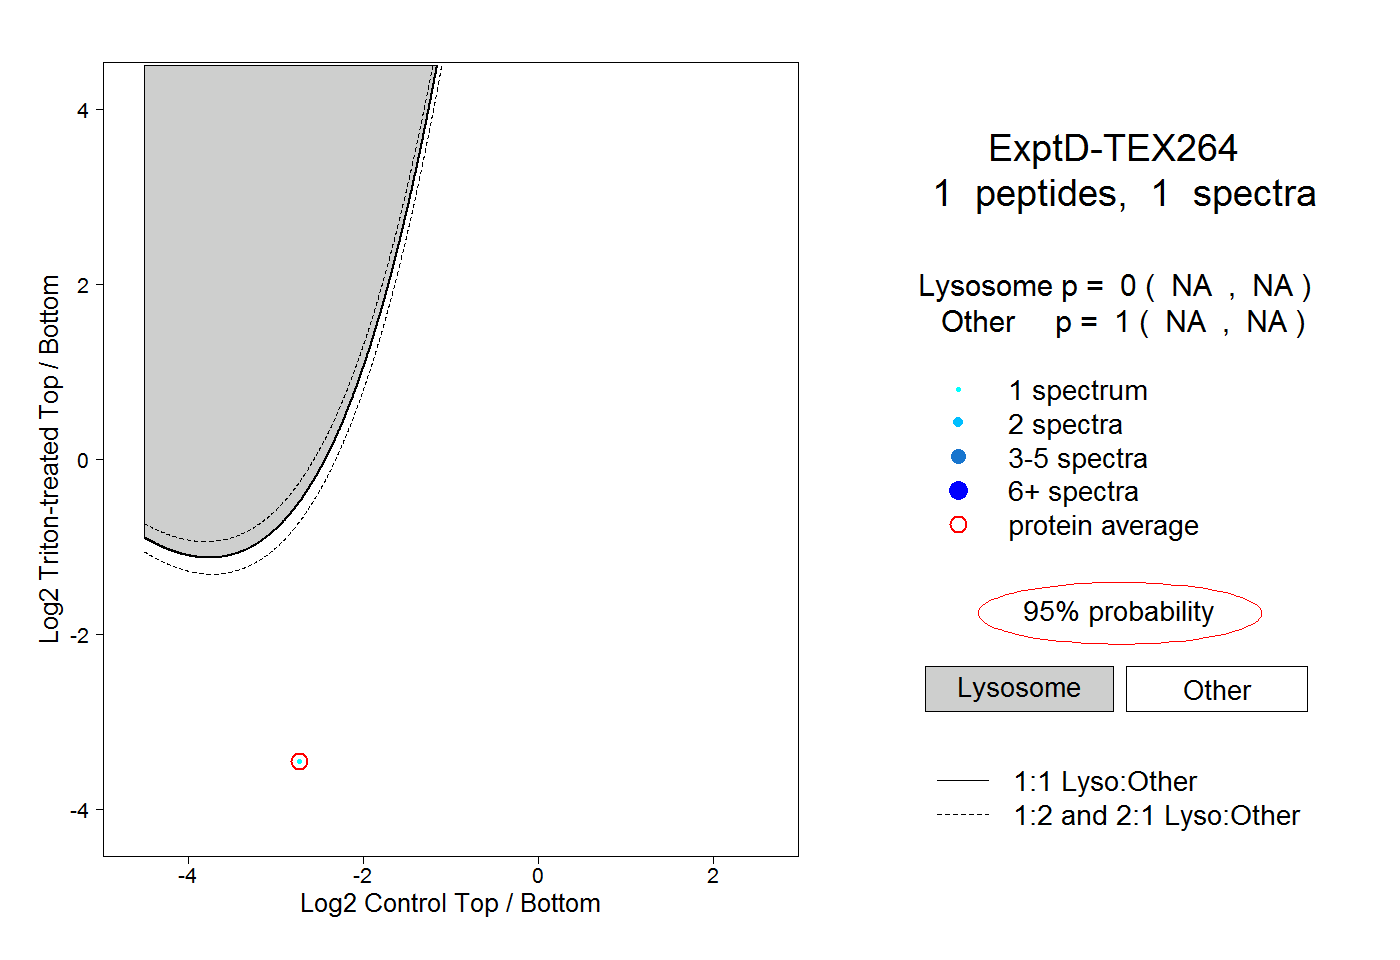 |
0.000 NA | NA |
1.000 NA | NA |