 2
2peptides
spectra
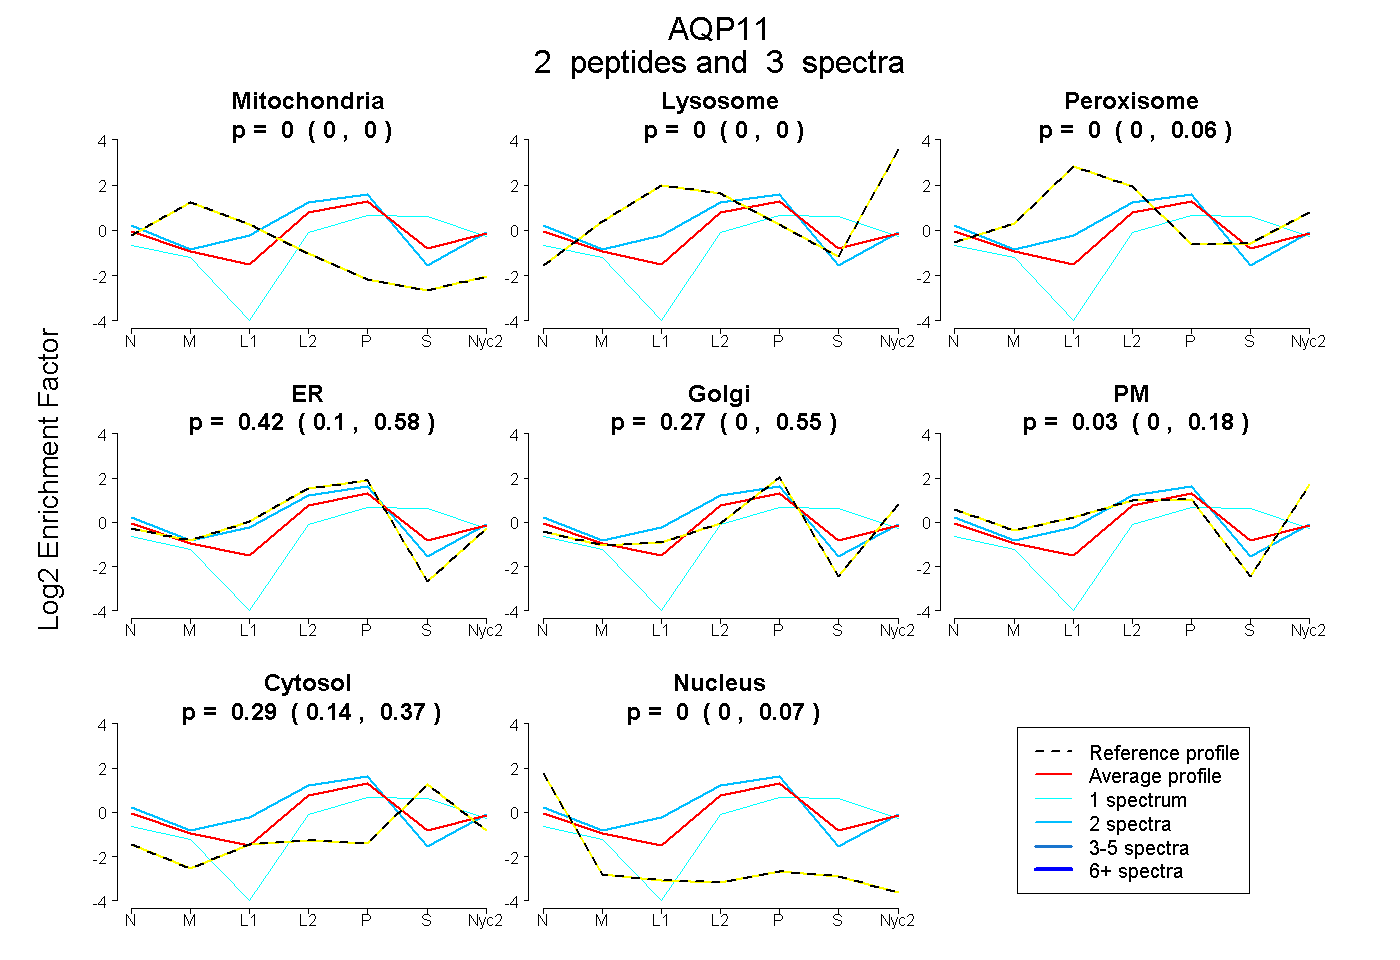
0.000 | 0.000
0.000 | 0.000
0.000 | 0.064
0.101 | 0.576
0.000 | 0.551
0.000 | 0.182
0.135 | 0.369
0.000 | 0.069
1peptide
spectrum
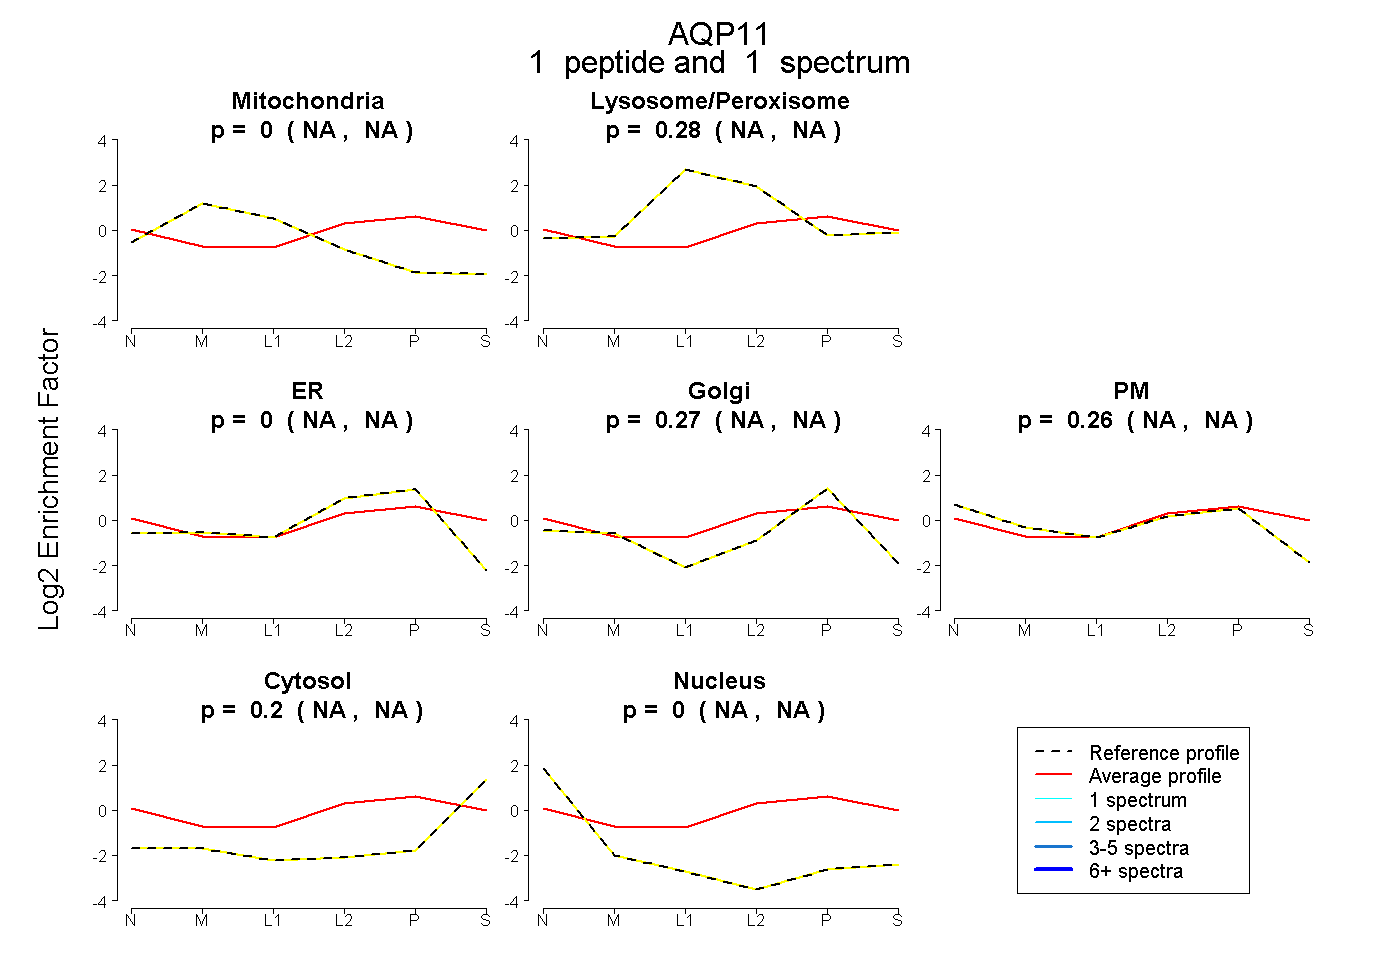
NA | NA
NA | NA
NA | NA
NA | NA
NA | NA
NA | NA
NA | NA
2peptides
spectra
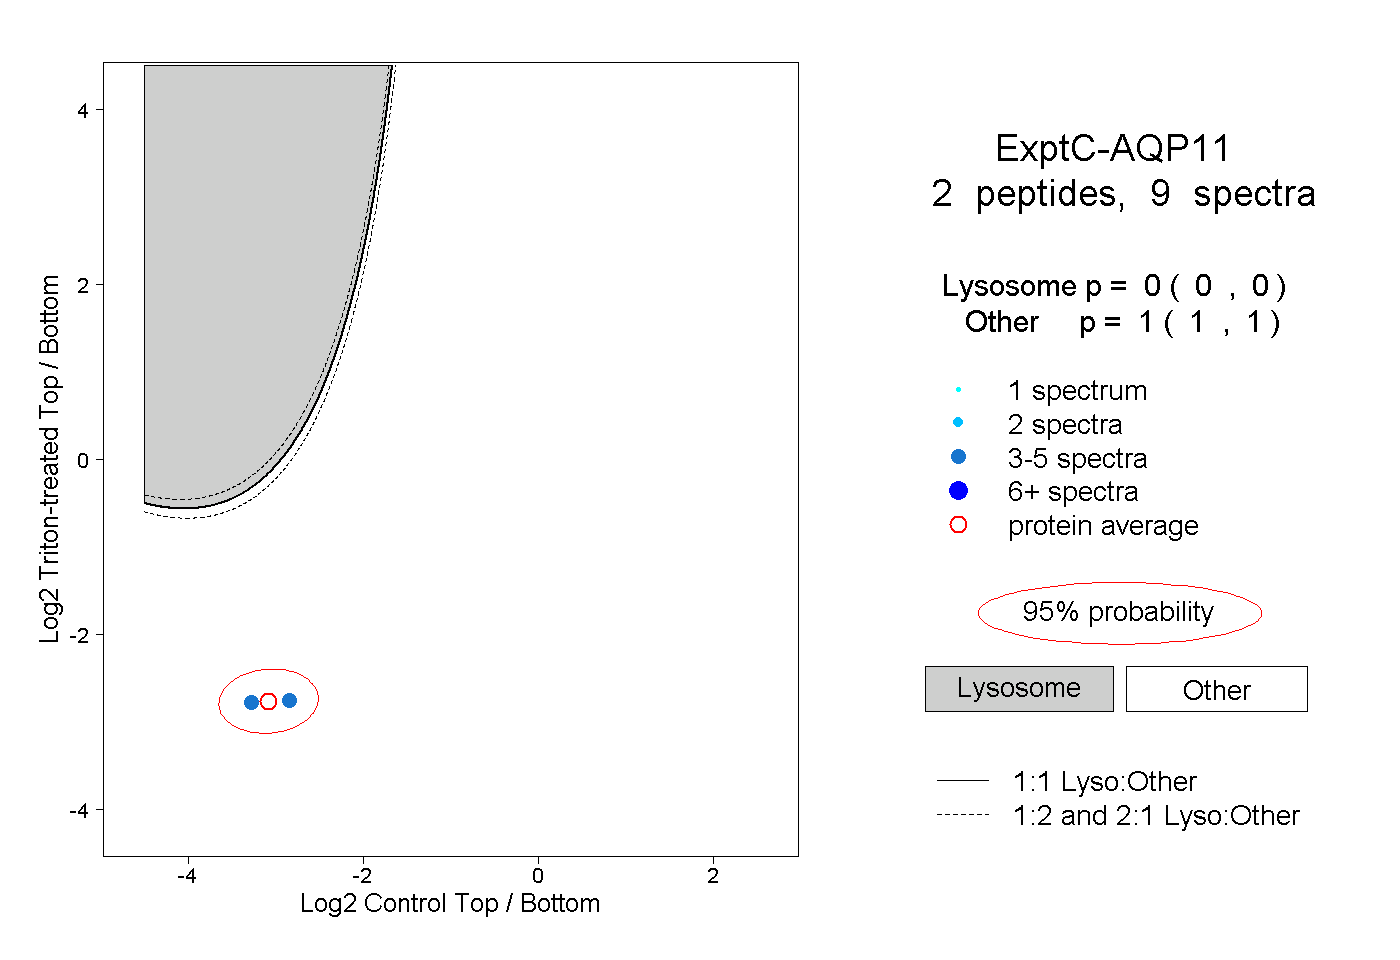
0.000 | 0.000
1.000 | 1.000