 1
1peptide
spectra

0.043 | 0.091
0.282 | 0.361
0.049 | 0.170
0.000 | 0.000
0.000 | 0.000
0.247 | 0.302
0.196 | 0.229
0.000 | 0.000
2peptides
spectra

0.147 | 0.187
0.206 | 0.231
0.000 | 0.000
0.000 | 0.000
0.318 | 0.365
0.255 | 0.273
0.000 | 0.007
5peptides
spectra
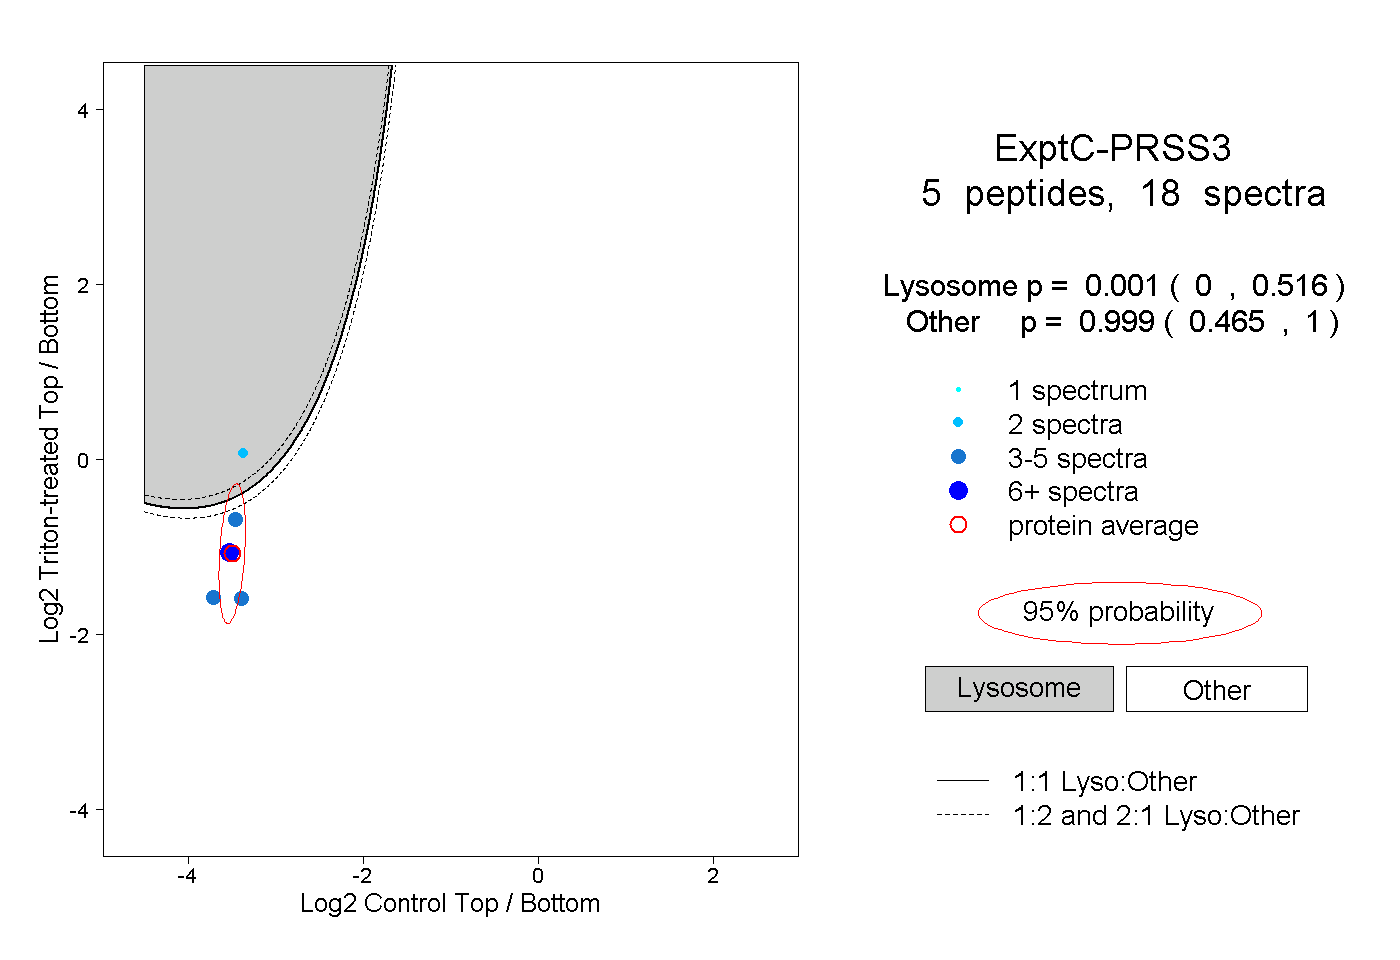
0.000 | 0.516
0.465 | 1.000
1peptide
spectra
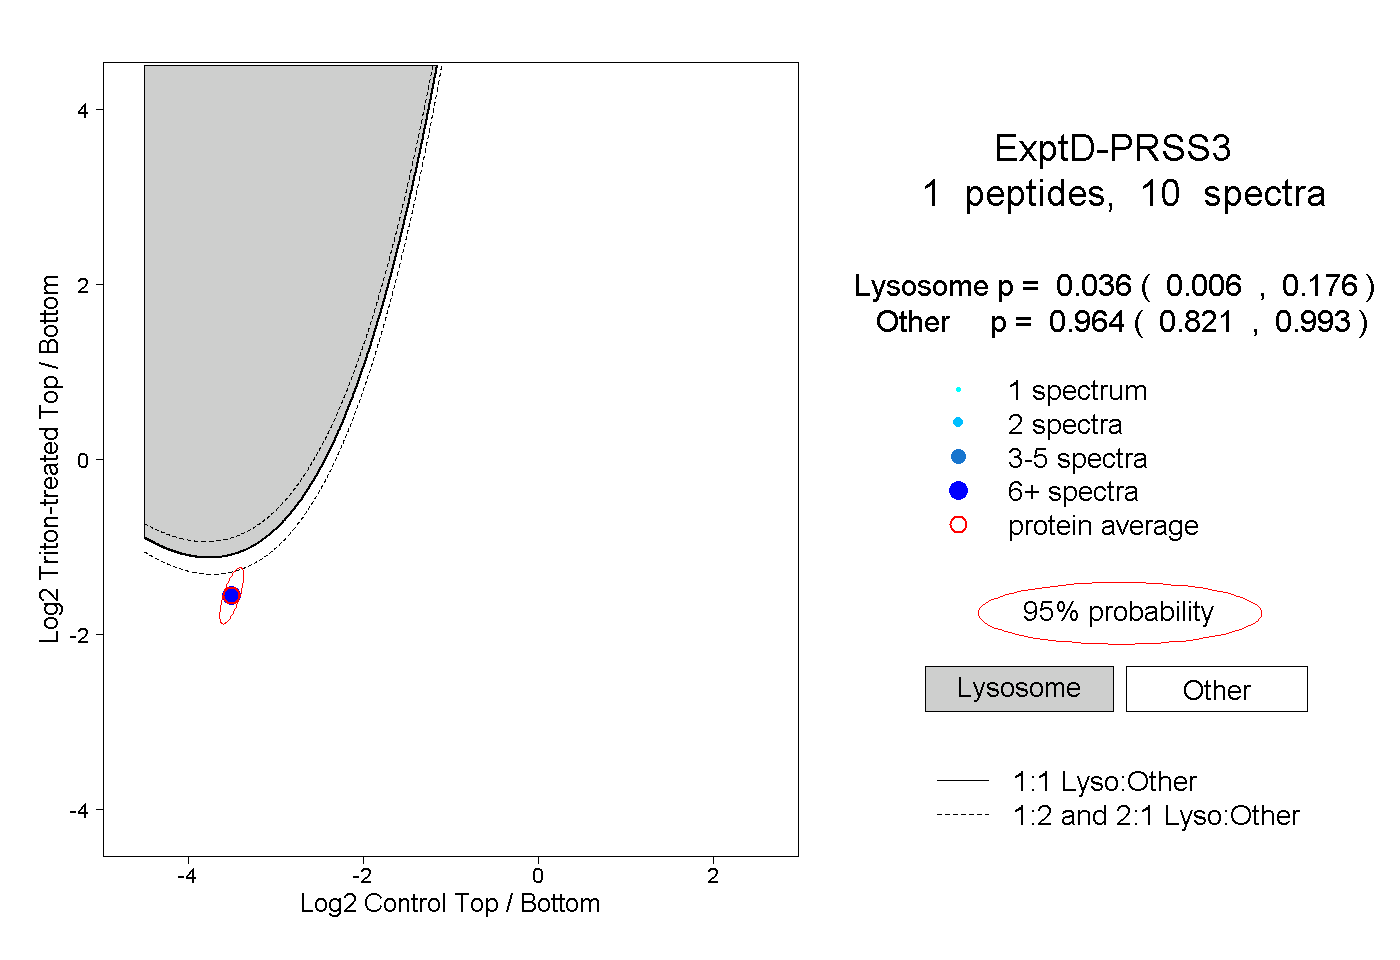
0.006 | 0.176
0.821 | 0.993