 2
2peptides
spectra
0.000 | 0.000
0.000 | 0.000
0.000 | 0.017
0.224 | 0.427
0.069 | 0.272
0.000 | 0.000
0.445 | 0.507
0.000 | 0.000
5peptides
spectra
0.000 | 0.000
1.000 | 1.000
| Plot | Mito | Lyso | Perox | ER | Golgi | PM | Cytosol | Nucleus | |||||
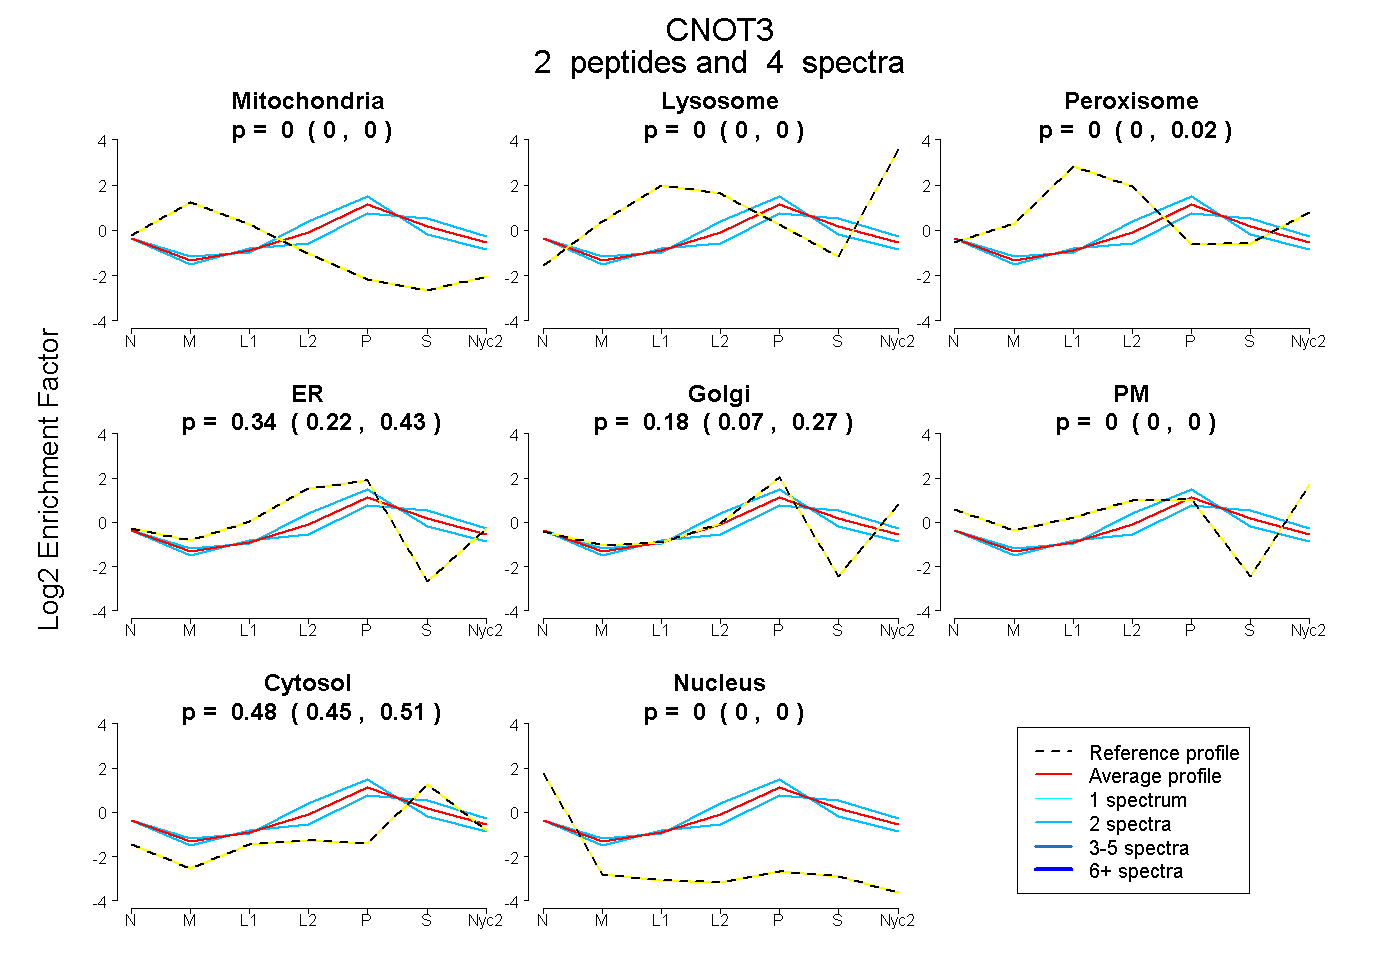
| Expt A |
2 peptides |
4 spectra |
|
0.000 0.000 | 0.000 |
0.000 0.000 | 0.000 |
0.000 0.000 | 0.017 |
0.342 0.224 | 0.427 |
0.178 0.069 | 0.272 |
0.000 0.000 | 0.000 |
0.480 0.445 | 0.507 |
0.000 0.000 | 0.000 |
||
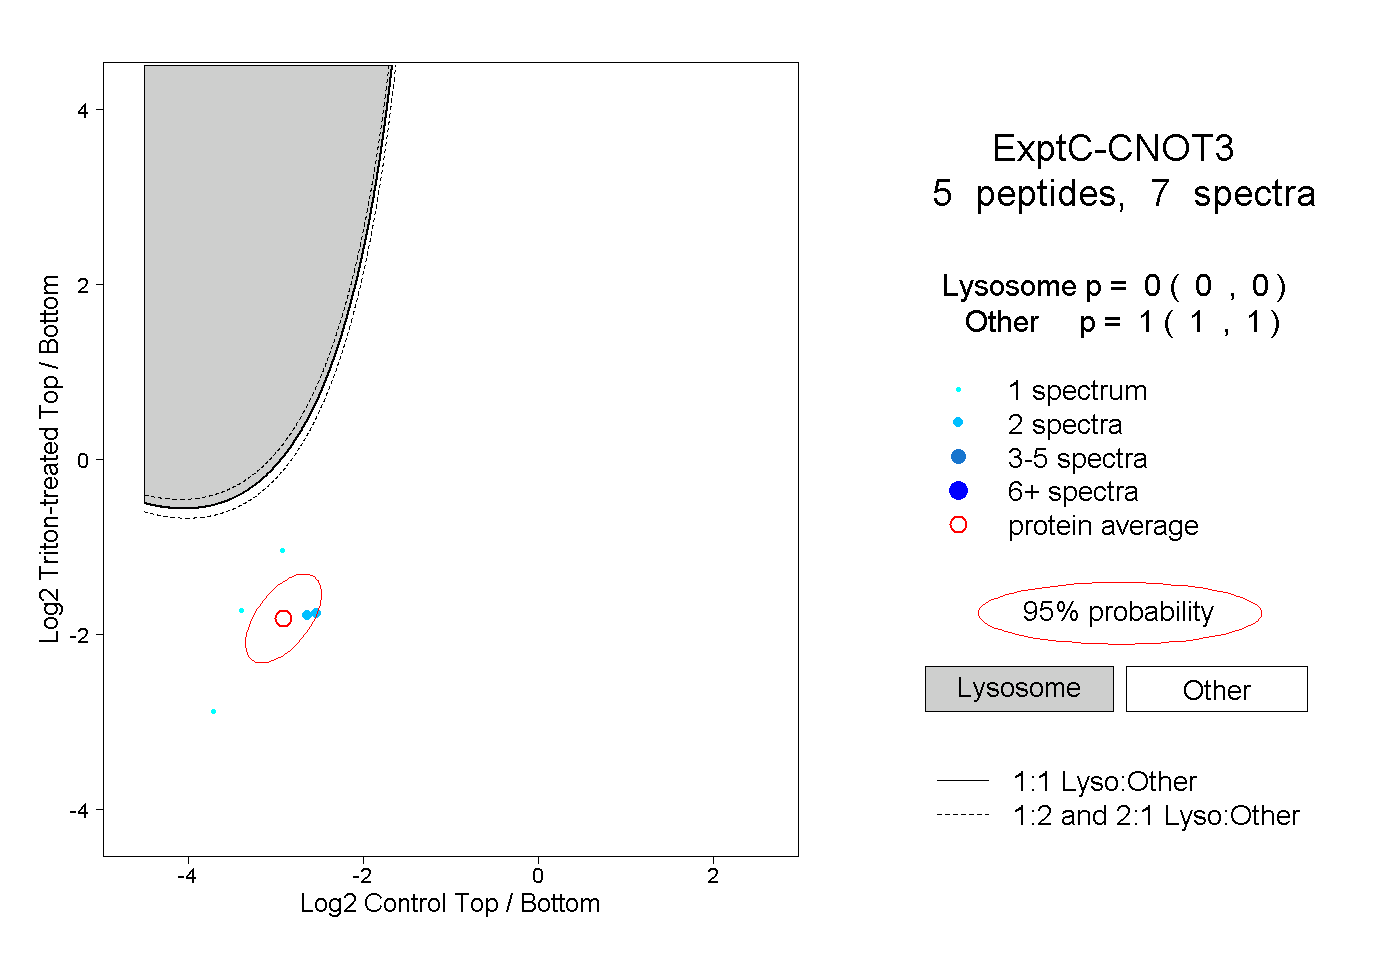
| Plot | Lyso | Other | |||||||||||
| Expt C |
5 peptides |
7 spectra |
|
0.000 0.000 | 0.000 |
1.000 1.000 | 1.000 |