PRKCSH
[ENSRNOP00000018009]
Main page
| | | Plot |
Mito |
Lyso |
|
Perox |
ER |
Golgi |
PM |
Cytosol |
Nucleus |
|
| Expt A |
 11
11
peptides |
77
spectra |
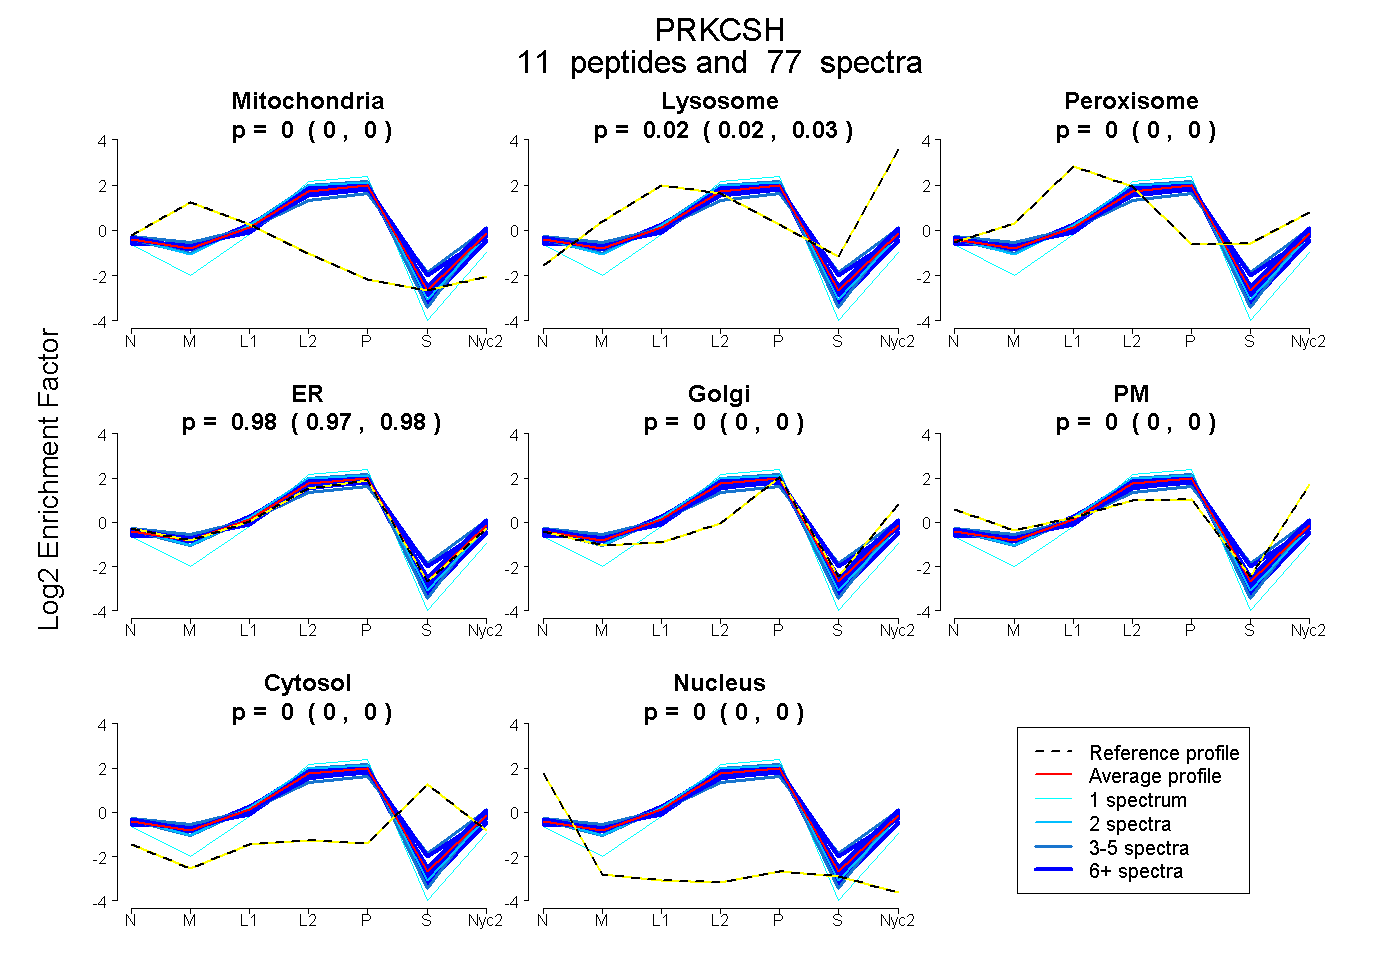 |
0.000
0.000 | 0.000 |
0.023
0.020 | 0.026 |
|
0.000
0.000 | 0.000 |
0.977
0.974 | 0.980 |
0.000
0.000 | 0.000 |
0.000
0.000 | 0.000 |
0.000
0.000 | 0.000 |
0.000
0.000 | 0.000 |
|
| | | Plot |
Mito |
|
Lyso or Perox |
|
ER |
Golgi |
PM |
Cytosol |
Nucleus |
|
| Expt B |
9
peptides |
37
spectra |
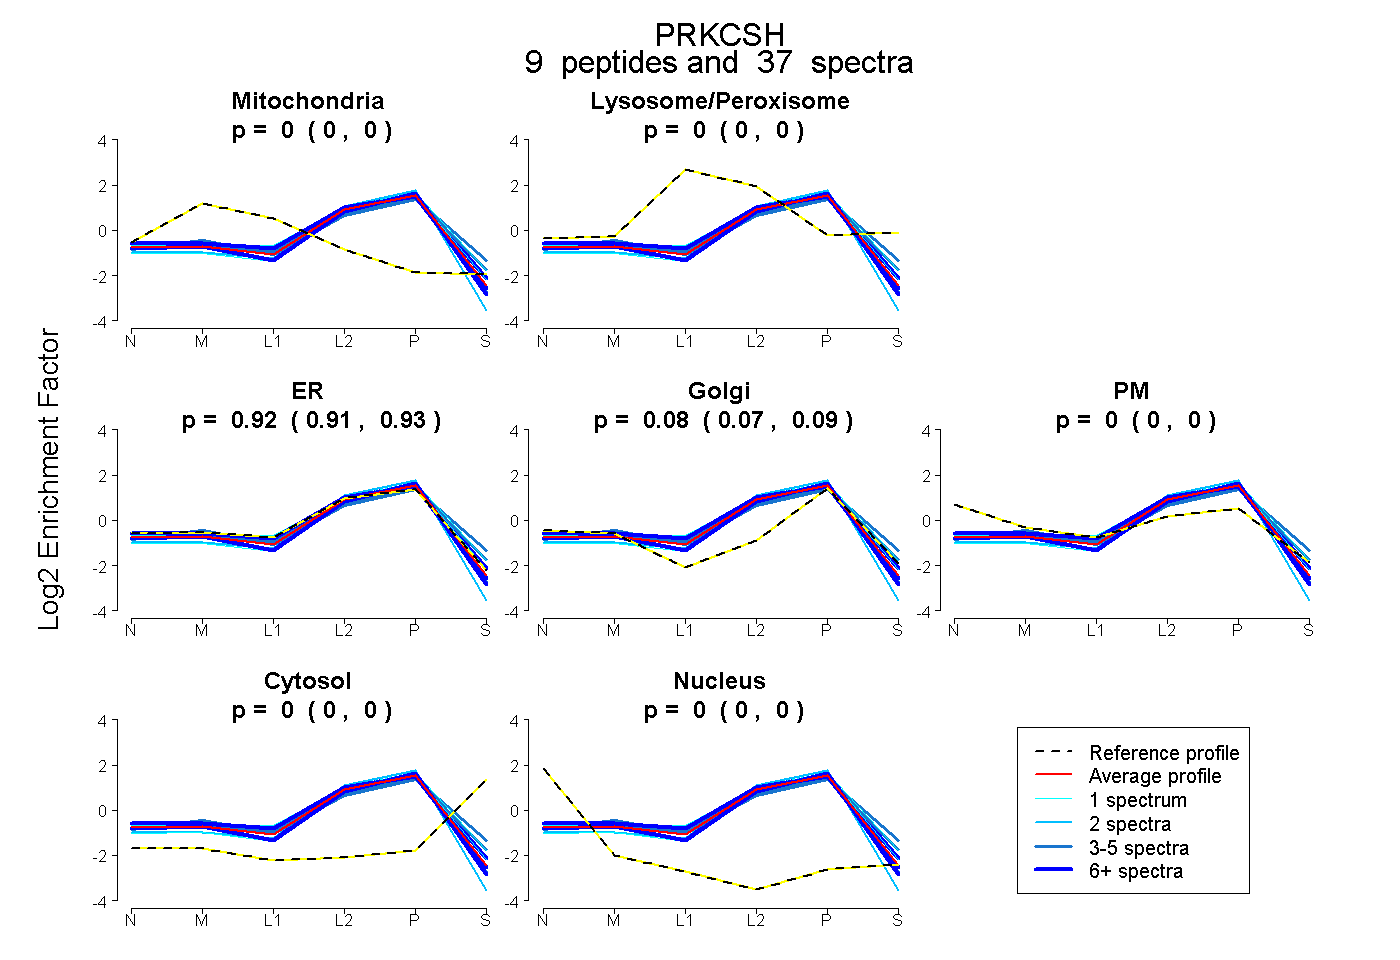 |
0.000
0.000 | 0.000 |
|
0.000
0.000 | 0.000 |
|
0.919
0.909 | 0.927 |
0.081
0.072 | 0.089 |
0.000
0.000 | 0.000 |
0.000
0.000 | 0.000 |
0.000
0.000 | 0.000 |
|
| 1 spectrum, LWEEQQAAAK |
0.000 |
|
0.000 |
|
1.000 |
0.000 |
0.000 |
0.000 |
0.000 |
|
| 6 spectra, EMEESIR |
0.000 |
|
0.000 |
|
0.875 |
0.125 |
0.000 |
0.000 |
0.000 |
|
| 7 spectra, SLEDQVETLR |
0.000 |
|
0.000 |
|
0.847 |
0.153 |
0.000 |
0.000 |
0.000 |
|
| 5 spectra, ILIEEWK |
0.000 |
|
0.000 |
|
1.000 |
0.000 |
0.000 |
0.000 |
0.000 |
|
| 2 spectra, EEAERPEK |
0.000 |
|
0.000 |
|
0.989 |
0.011 |
0.000 |
0.000 |
0.000 |
|
| 9 spectra, VWAAIR |
0.000 |
|
0.000 |
|
1.000 |
0.000 |
0.000 |
0.000 |
0.000 |
|
| 3 spectra, ETVVTSTTEPSR |
0.000 |
|
0.051 |
|
0.788 |
0.074 |
0.000 |
0.086 |
0.000 |
|
| 3 spectra, ESLQQLAEVTR |
0.000 |
|
0.000 |
|
0.831 |
0.100 |
0.000 |
0.068 |
0.000 |
|
| 1 spectrum, FEEVER |
0.000 |
|
0.000 |
|
0.863 |
0.092 |
0.000 |
0.045 |
0.000 |
|
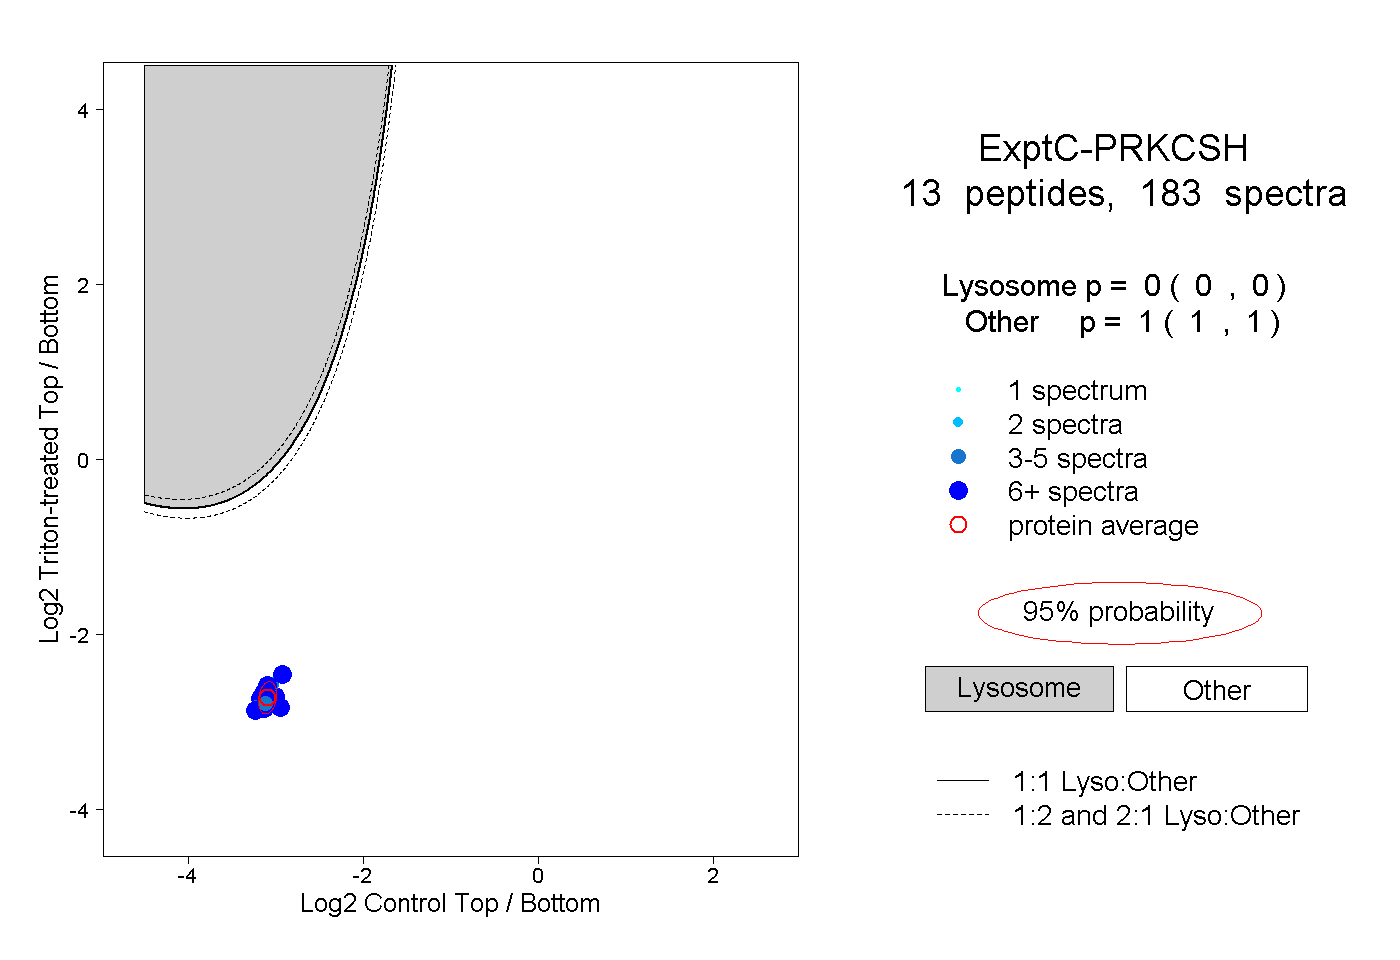
| | | Plot |
|
Lyso |
|
|
|
|
|
|
|
Other |
| Expt C |
13
peptides |
183
spectra |
 |
|
0.000
0.000 | 0.000 |
|
|
|
|
|
|
|
1.000
1.000 | 1.000 |
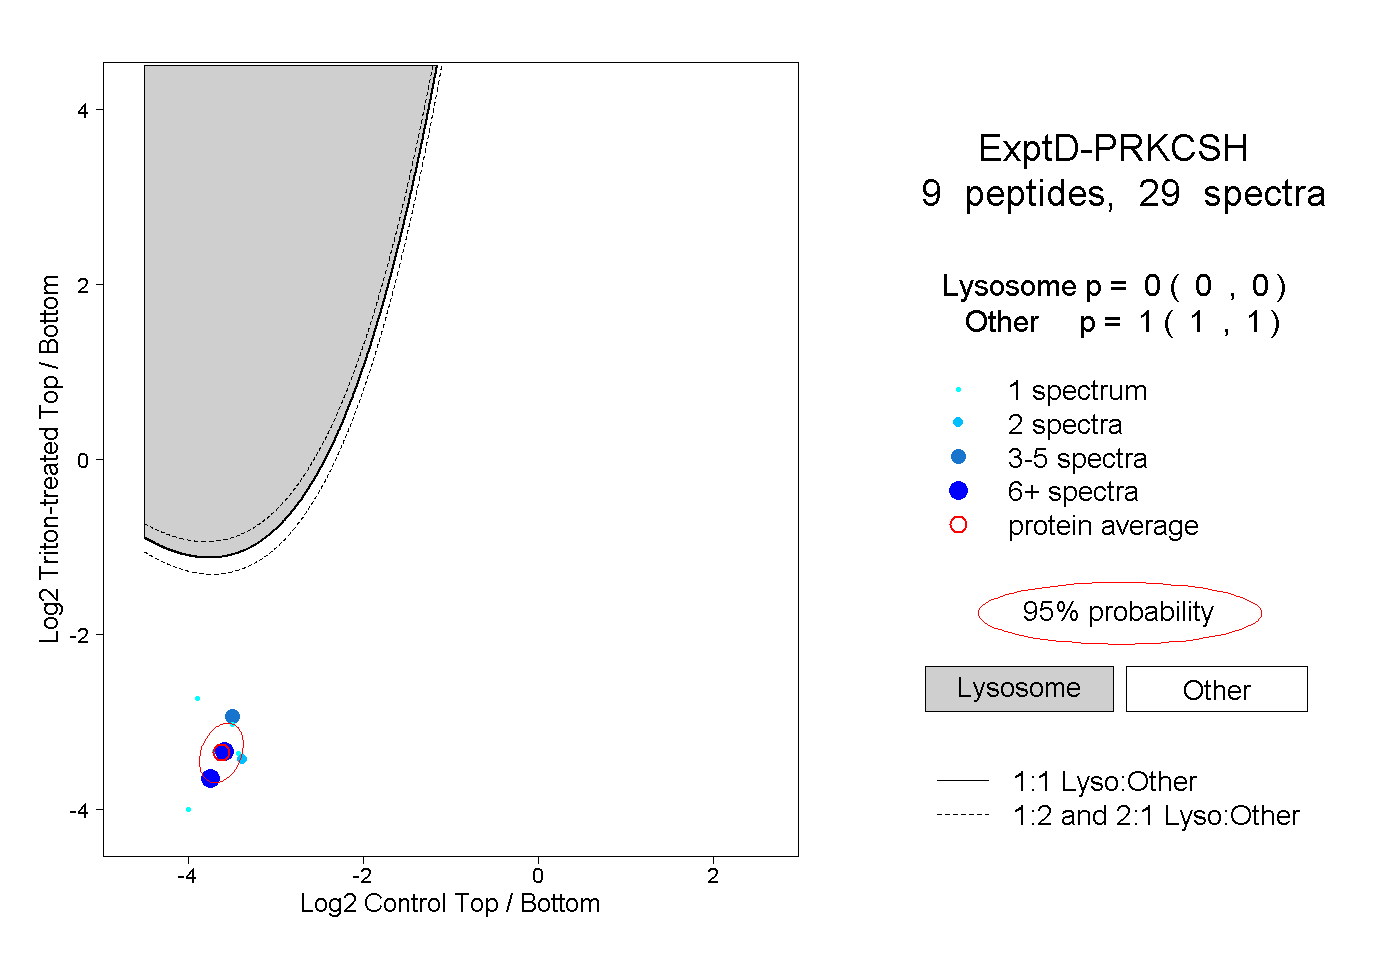
| | | Plot |
|
Lyso |
|
|
|
|
|
|
|
Other |
| Expt D |
9
peptides |
29
spectra |
 |
|
0.000
0.000 | 0.000 |
|
|
|
|
|
|
|
1.000
1.000 | 1.000 |