 8
8peptides
spectra
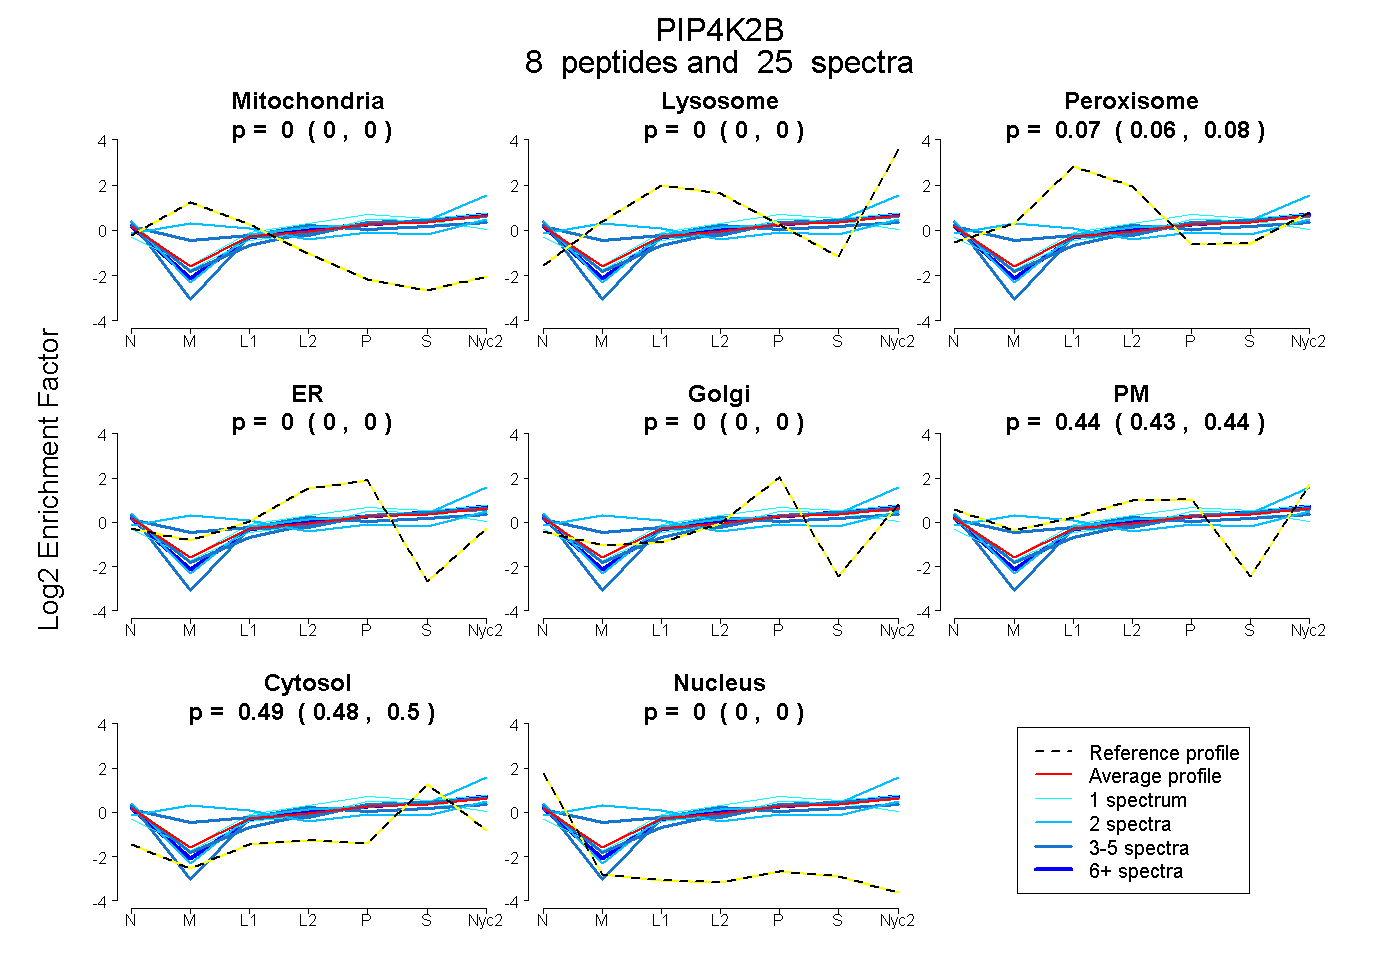
0.000 | 0.000
0.000 | 0.000
0.057 | 0.082
0.000 | 0.000
0.000 | 0.000
0.428 | 0.445
0.481 | 0.501
0.000 | 0.000
2peptides
spectra
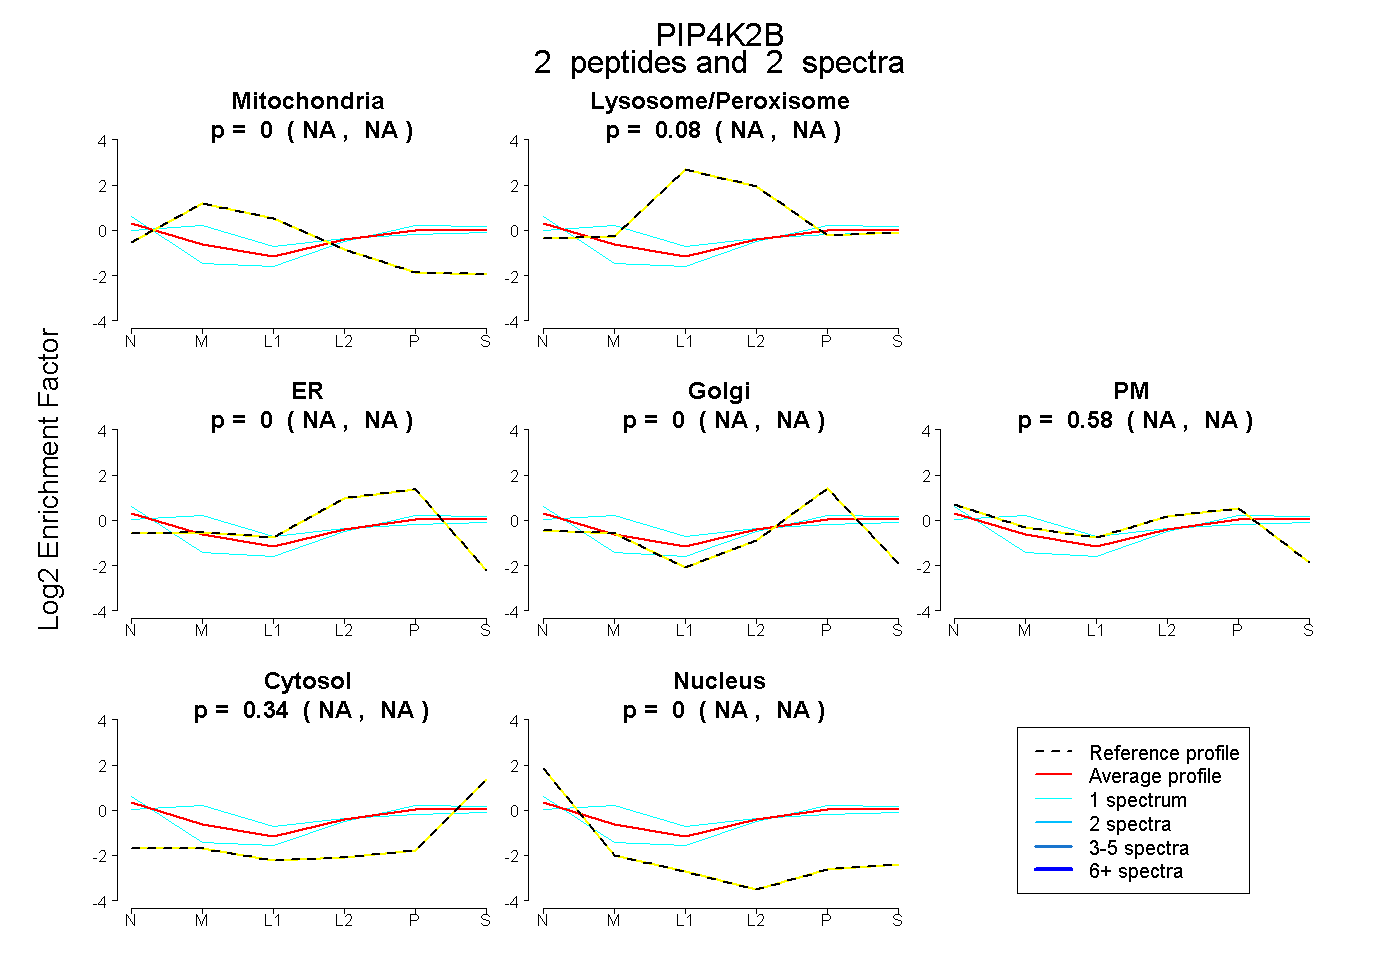
NA | NA
NA | NA
NA | NA
NA | NA
NA | NA
NA | NA
NA | NA
4peptides
spectra

0.000 | 0.000
1.000 | 1.000
1peptide
spectrum

NA | NA
NA | NA