 11
11peptides
spectra
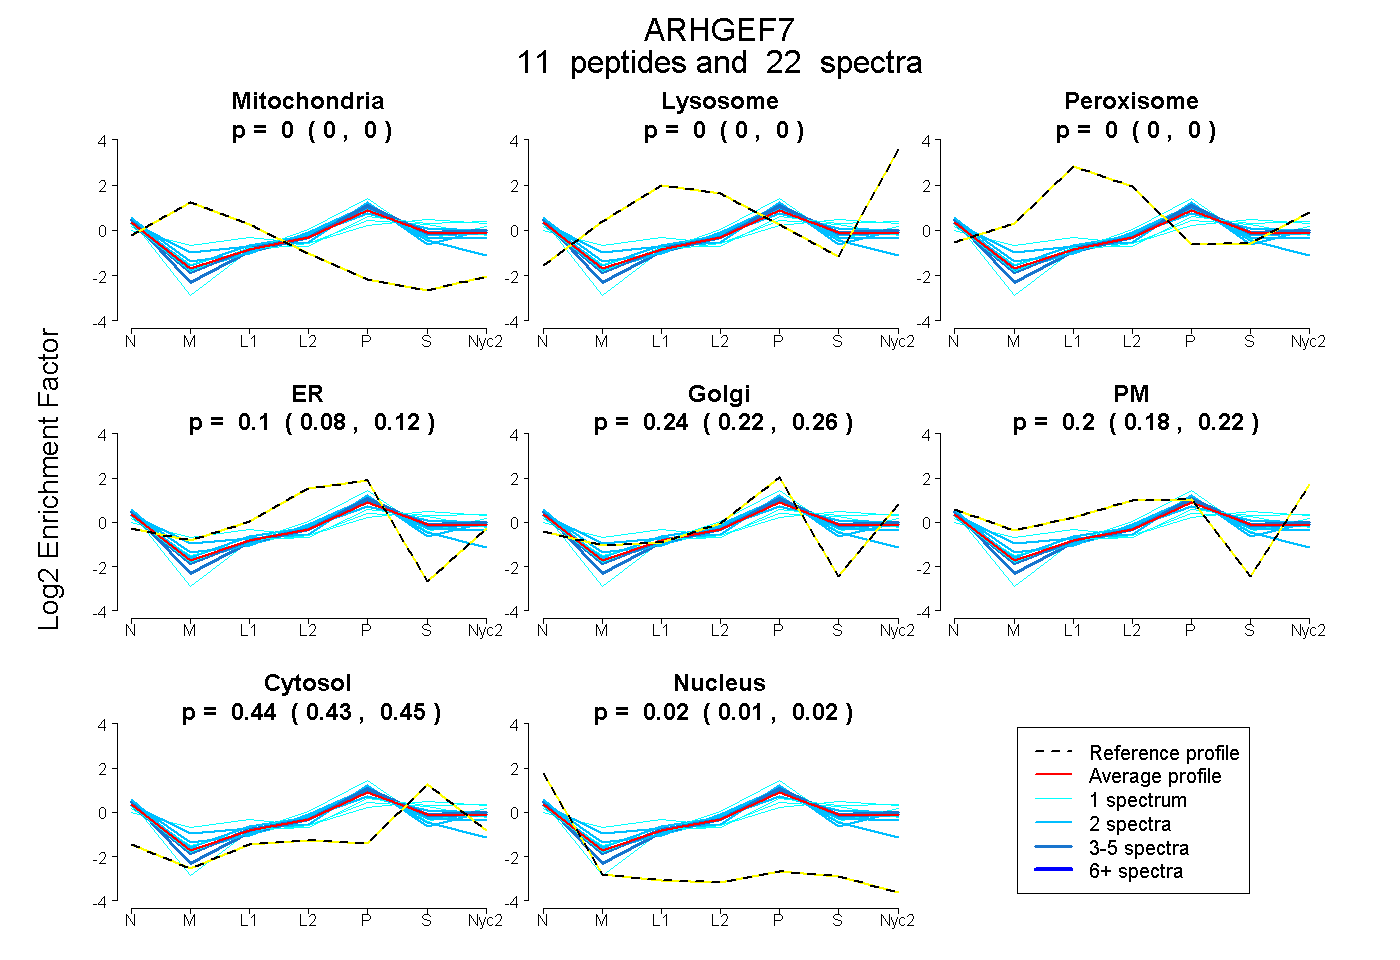
0.000 | 0.000
0.000 | 0.000
0.000 | 0.000
0.084 | 0.120
0.219 | 0.255
0.178 | 0.215
0.435 | 0.451
0.010 | 0.021
| Plot | Mito | Lyso | Perox | ER | Golgi | PM | Cytosol | Nucleus | |||||
| Expt A |
11 peptides |
22 spectra |
|
0.000 0.000 | 0.000 |
0.000 0.000 | 0.000 |
0.000 0.000 | 0.000 |
0.104 0.084 | 0.120 |
0.239 0.219 | 0.255 |
0.199 0.178 | 0.215 |
0.443 0.435 | 0.451 |
0.016 0.010 | 0.021 |
| 1 spectrum, NAFEISGSMIER | 0.000 | 0.000 | 0.000 | 0.000 | 0.005 | 0.410 | 0.585 | 0.000 | ||
| 1 spectrum, ESAPQVLLPEEEK | 0.047 | 0.000 | 0.172 | 0.000 | 0.270 | 0.081 | 0.430 | 0.000 | ||
| 2 spectra, HMEDYHPDR | 0.000 | 0.000 | 0.000 | 0.099 | 0.097 | 0.320 | 0.484 | 0.000 | ||
| 2 spectra, SPEAQQR | 0.000 | 0.000 | 0.000 | 0.213 | 0.200 | 0.145 | 0.387 | 0.056 | ||
| 4 spectra, SWEGDDIK | 0.000 | 0.000 | 0.000 | 0.070 | 0.316 | 0.171 | 0.443 | 0.000 | ||
| 2 spectra, MSGFIYQGK | 0.000 | 0.000 | 0.039 | 0.000 | 0.479 | 0.164 | 0.282 | 0.036 | ||
| 1 spectrum, TGWFPSNYVR | 0.000 | 0.000 | 0.000 | 0.000 | 0.164 | 0.305 | 0.532 | 0.000 | ||
| 4 spectra, SLEEEQR | 0.000 | 0.000 | 0.000 | 0.098 | 0.351 | 0.099 | 0.433 | 0.020 | ||
| 1 spectrum, QTLNSSSR | 0.000 | 0.000 | 0.000 | 0.131 | 0.450 | 0.036 | 0.382 | 0.000 | ||
| 2 spectra, NLSAQCQEVR | 0.000 | 0.000 | 0.000 | 0.479 | 0.072 | 0.000 | 0.343 | 0.106 | ||
| 2 spectra, ELELQILTEPIR | 0.000 | 0.000 | 0.000 | 0.092 | 0.289 | 0.182 | 0.400 | 0.037 |
| Plot | Mito | Lyso or Perox | ER | Golgi | PM | Cytosol | Nucleus | ||||||
| Expt B |
2 peptides |
2 spectra |
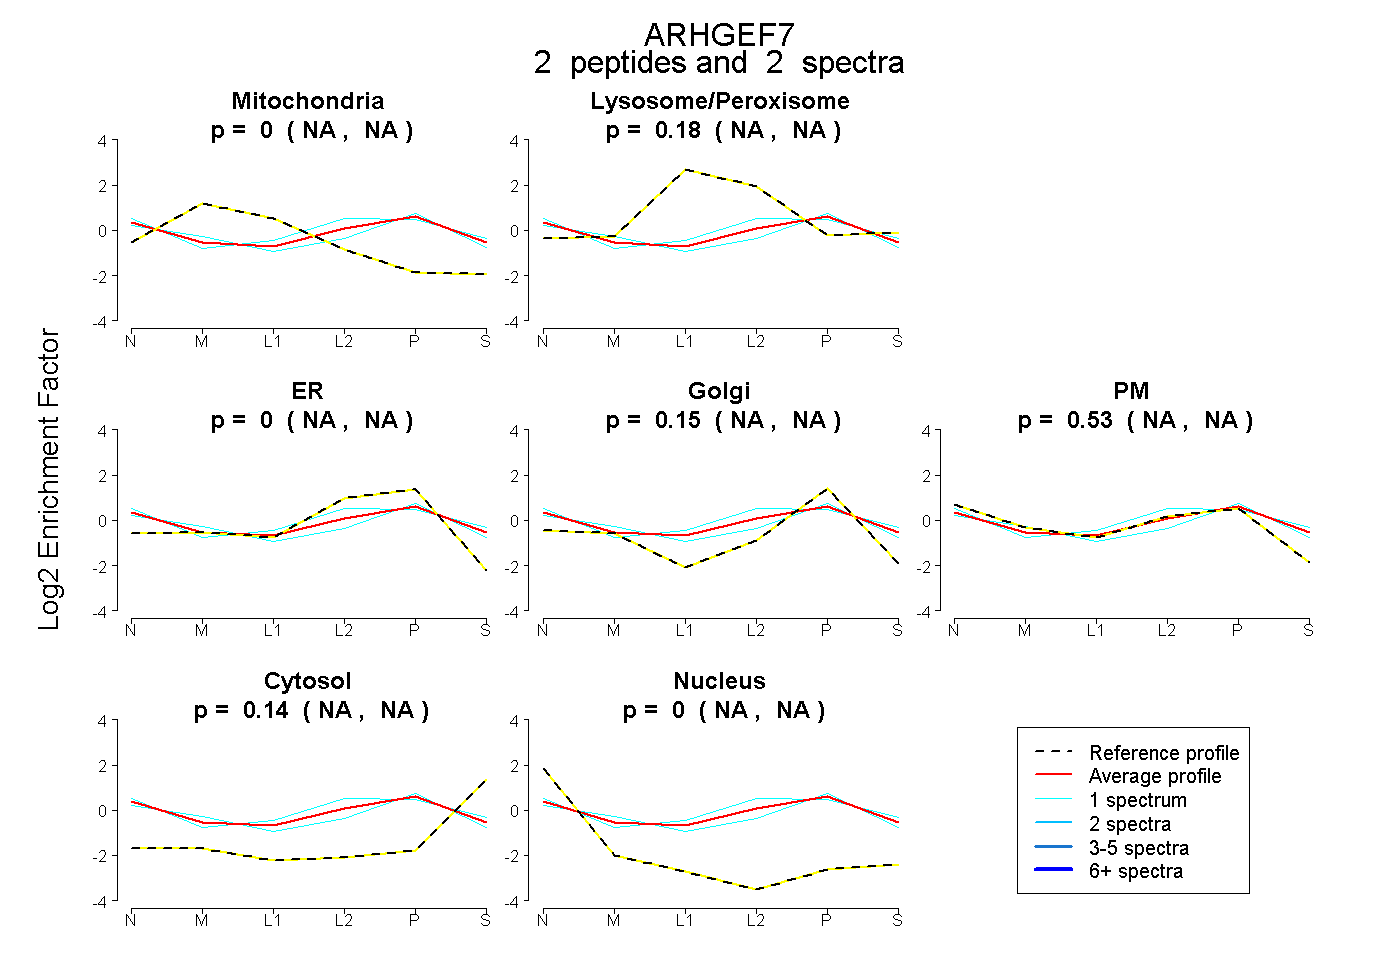 |
0.000 NA | NA |
0.176 NA | NA |
0.000 NA | NA |
0.148 NA | NA |
0.533 NA | NA |
0.143 NA | NA |
0.000 NA | NA |
|||
| Plot | Lyso | Other | |||||||||||
| Expt C |
2 peptides |
3 spectra |
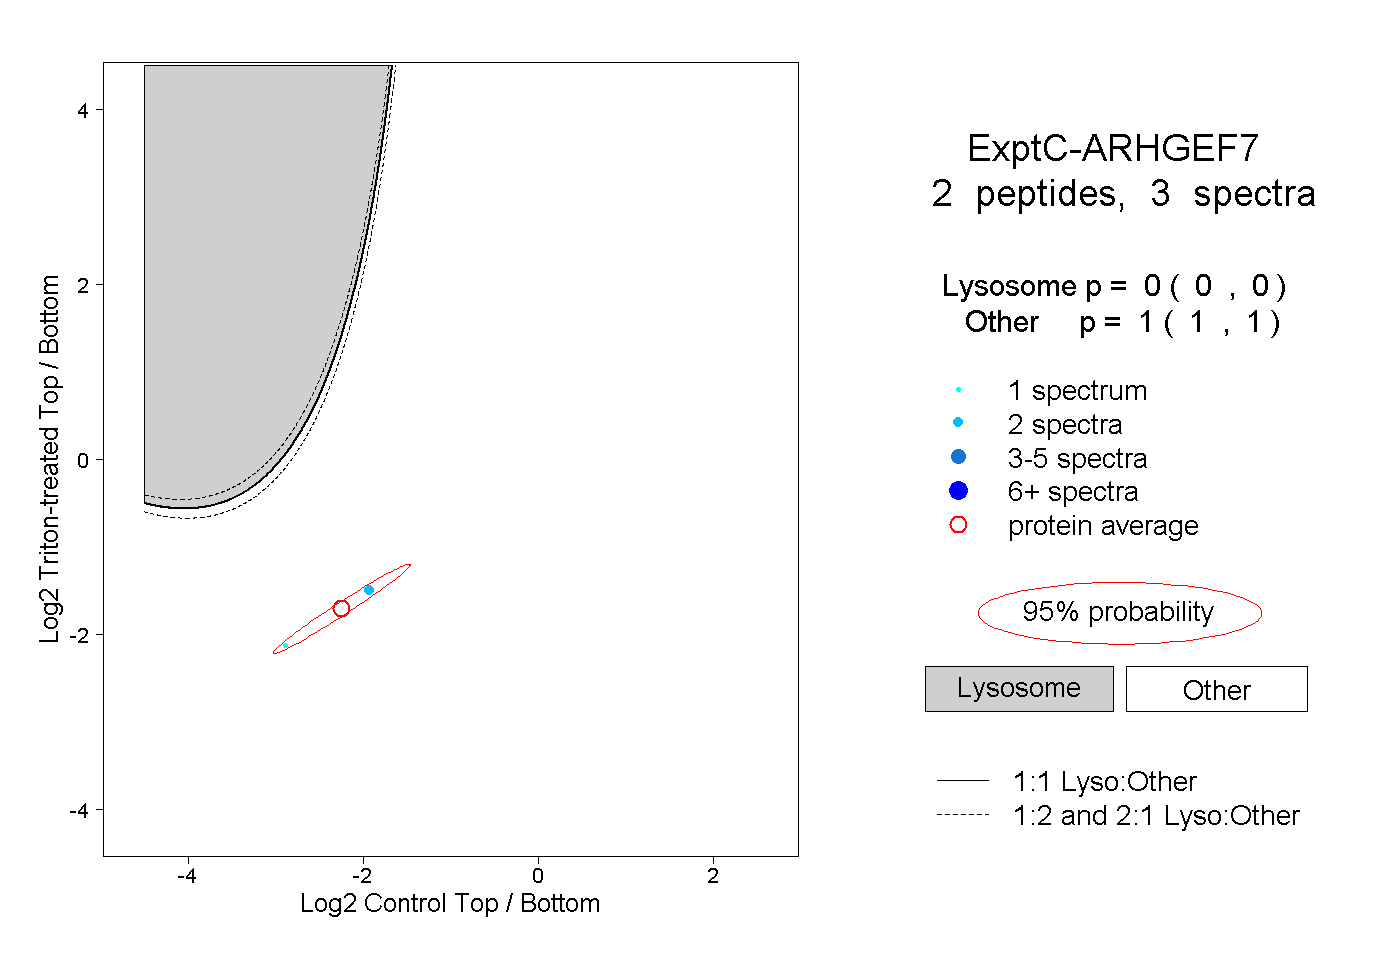 |
0.000 0.000 | 0.000 |
1.000 1.000 | 1.000 |
||||||||
| Plot | Lyso | Other | |||||||||||
| Expt D |
1 peptide |
3 spectra |
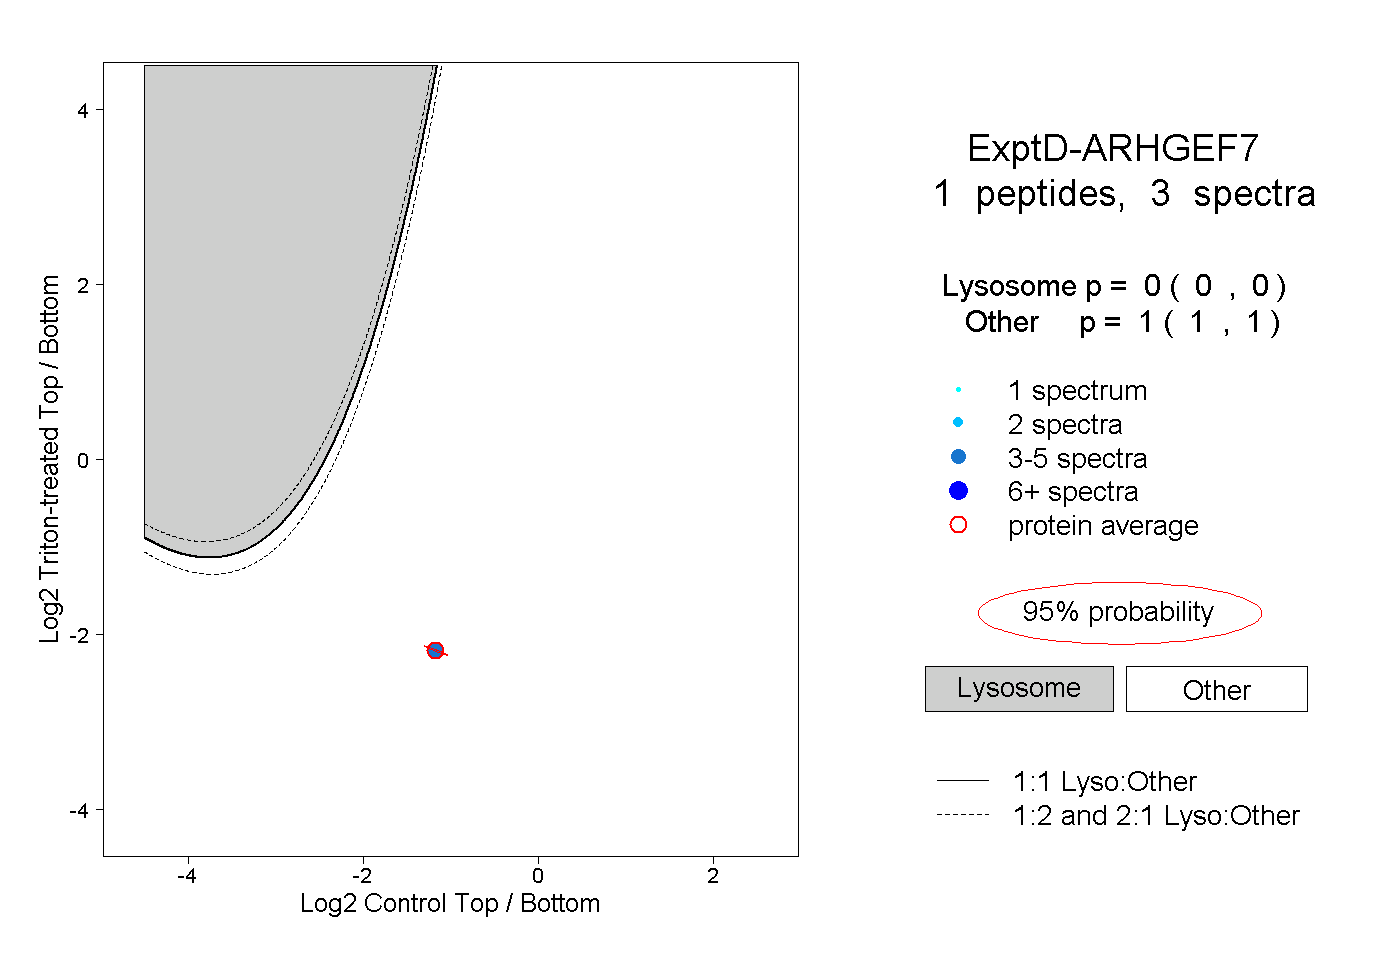 |
0.000 0.000 | 0.000 |
1.000 1.000 | 1.000 |