 15
15peptides
spectra
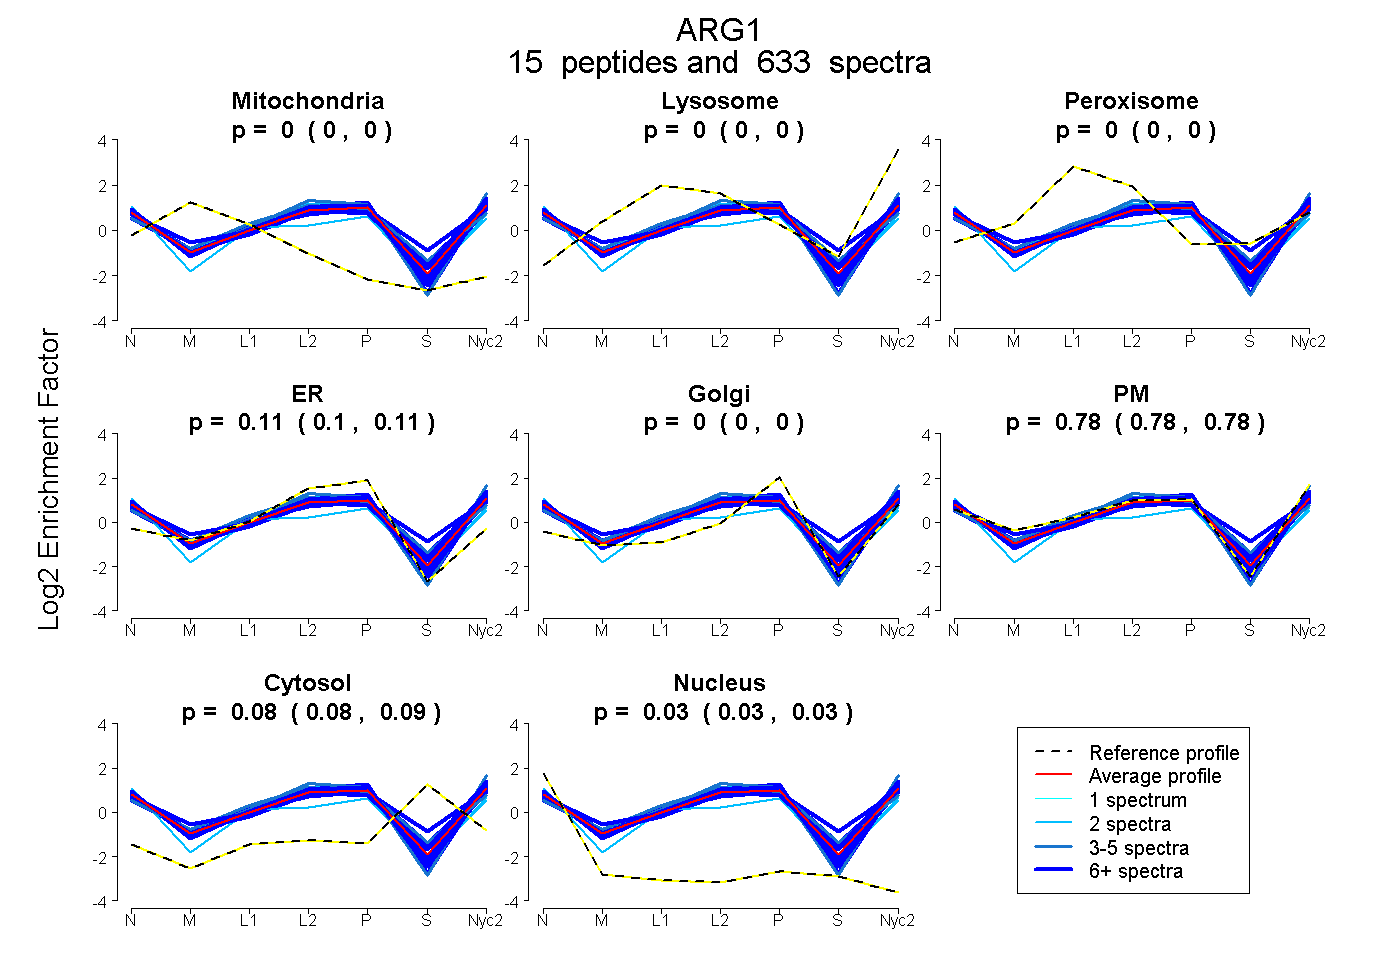
0.000 | 0.000
0.000 | 0.000
0.000 | 0.000
0.104 | 0.107
0.000 | 0.000
0.781 | 0.784
0.082 | 0.086
0.027 | 0.028
15peptides
spectra
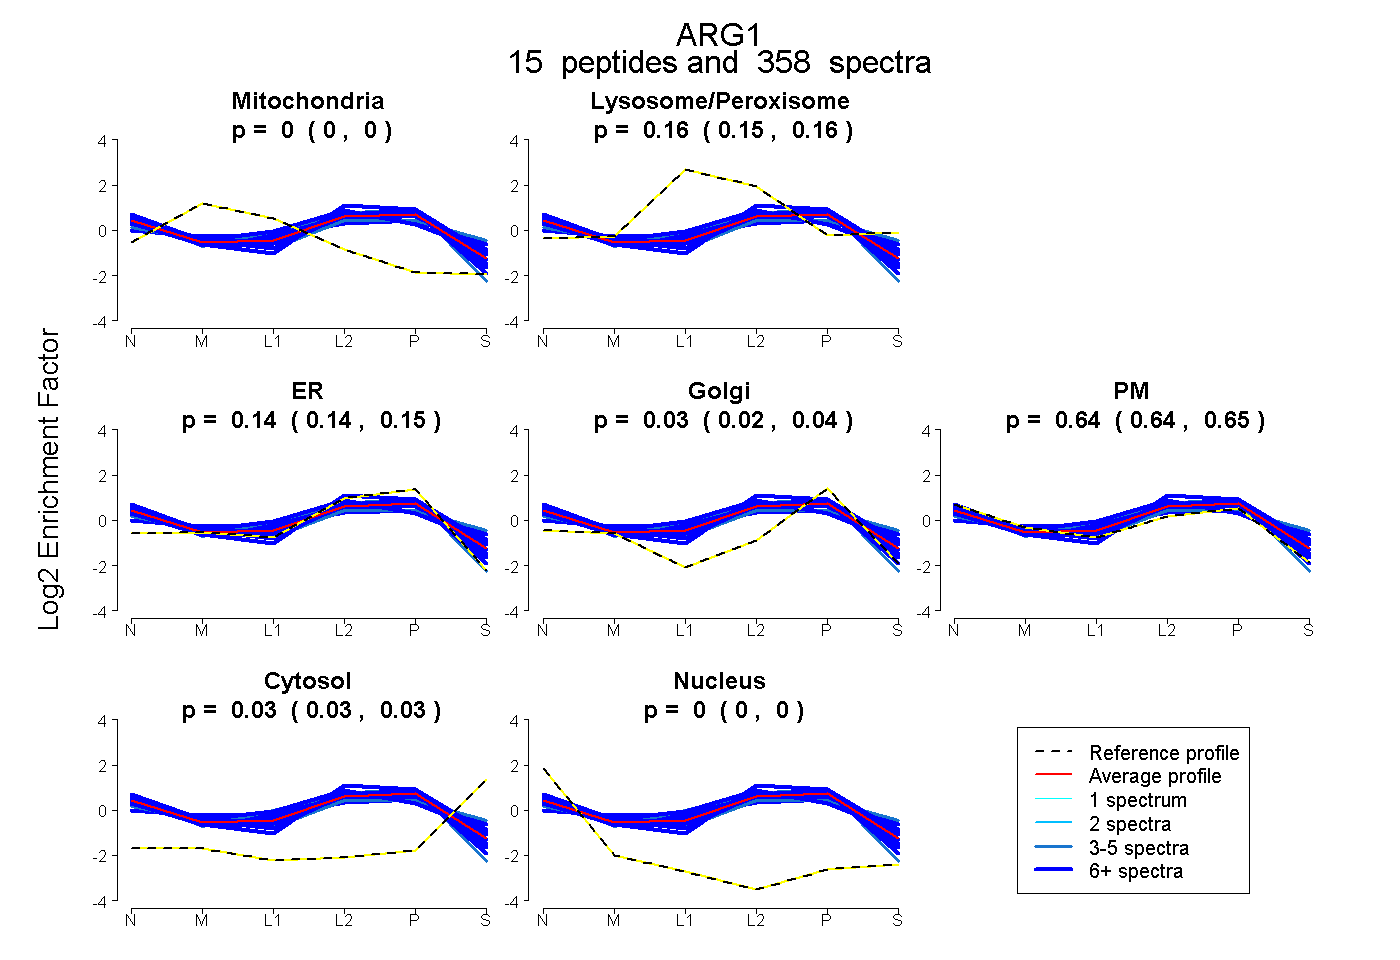
0.000 | 0.000
0.153 | 0.159
0.136 | 0.148
0.023 | 0.036
0.637 | 0.646
0.028 | 0.032
0.000 | 0.000
15peptides
spectra
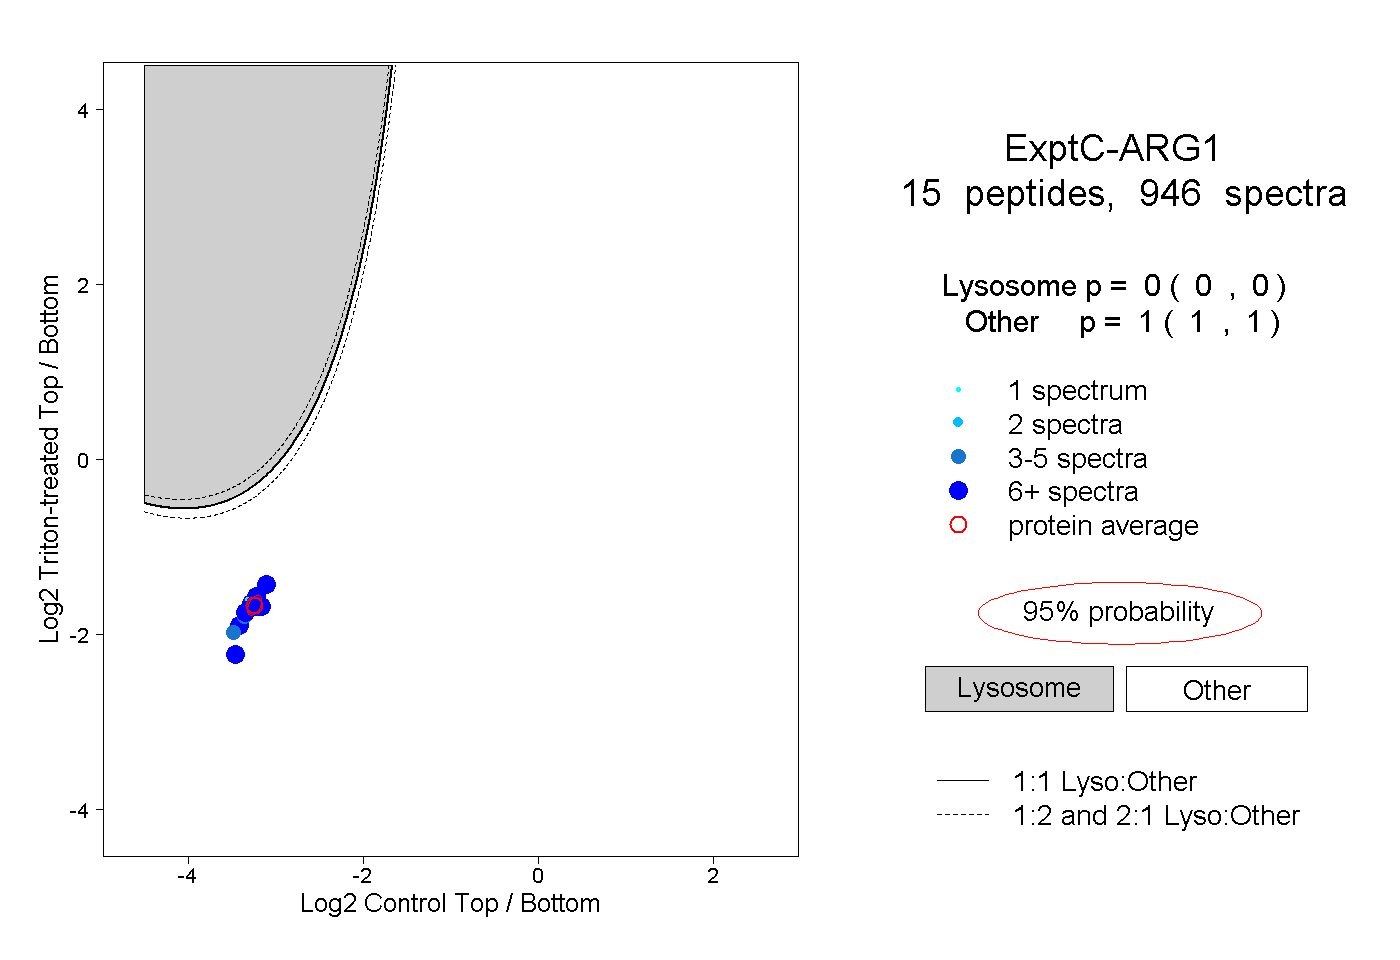
0.000 | 0.000
1.000 | 1.000
10peptides
spectra
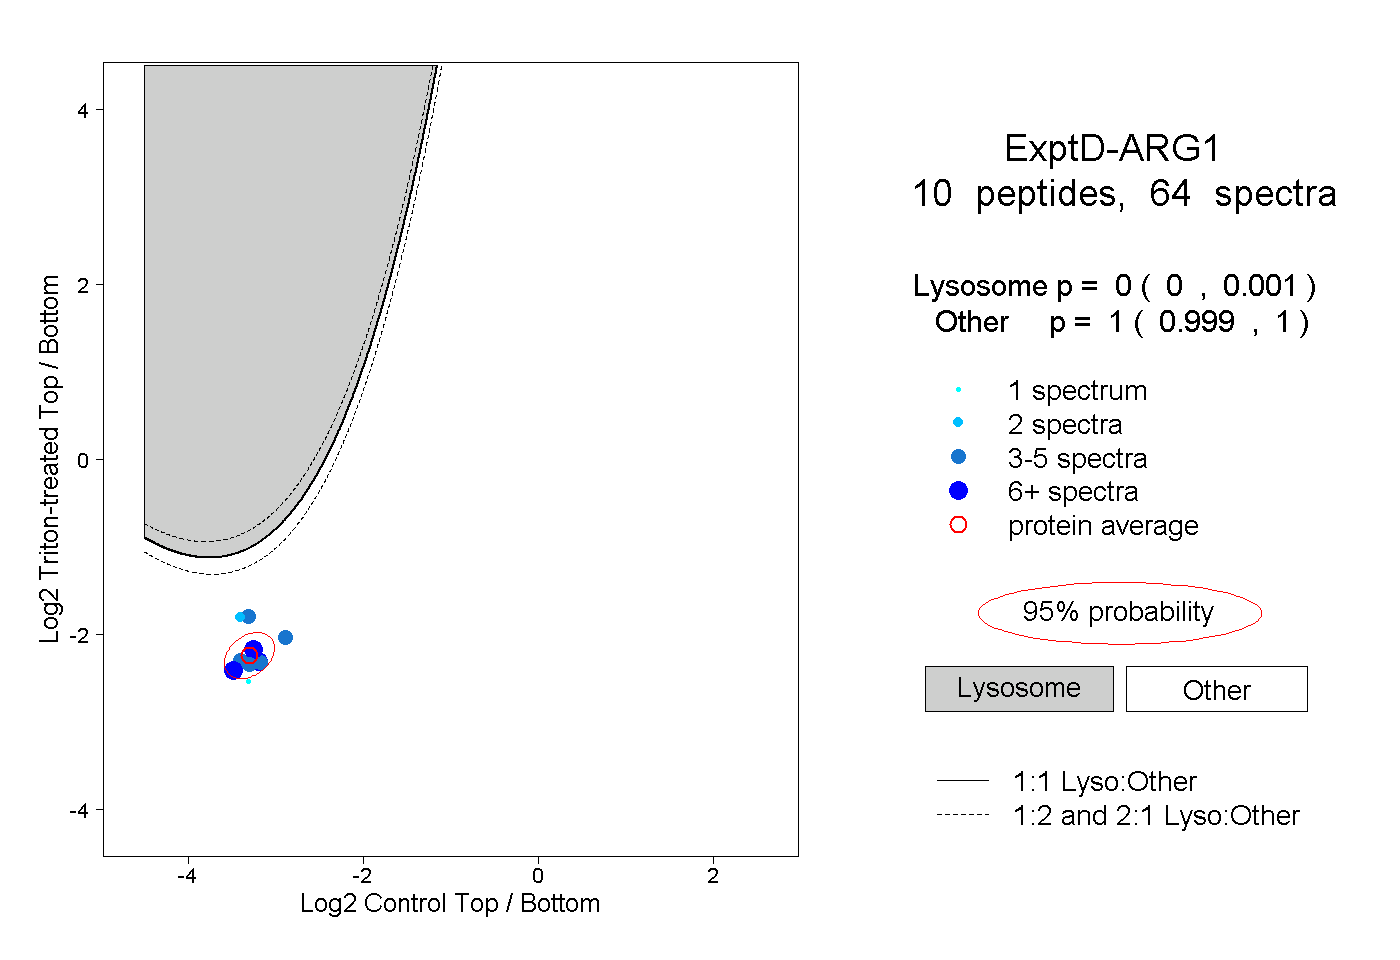
0.000 | 0.001
0.999 | 1.000