 2
2peptides
spectra
0.093 | 0.258
0.000 | 0.098
0.015 | 0.276
0.000 | 0.000
0.031 | 0.491
0.027 | 0.466
0.000 | 0.157
0.000 | 0.000
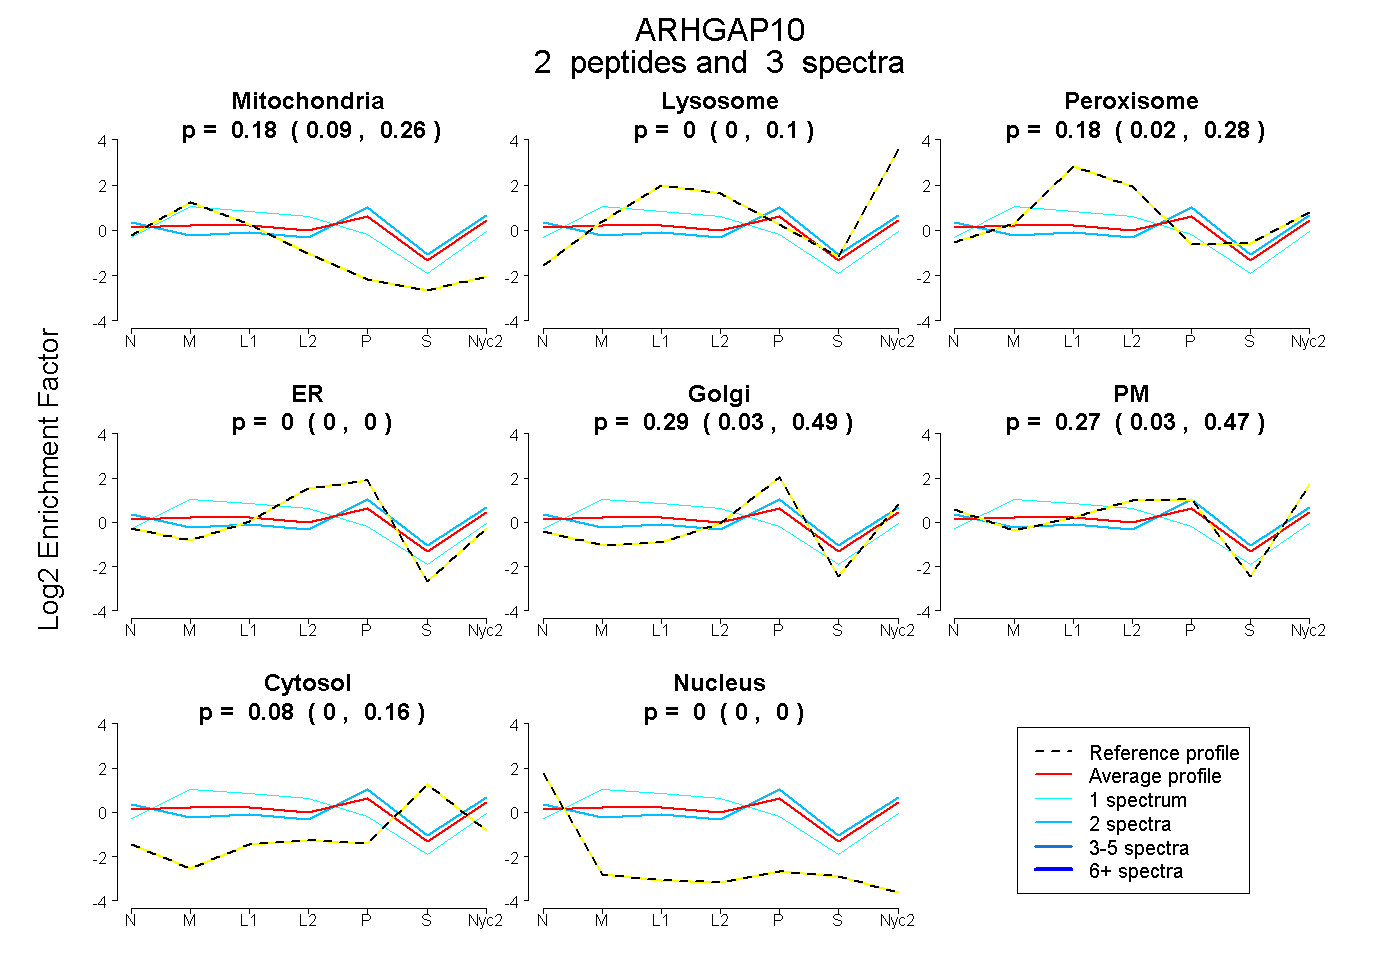
| Plot | Mito | Lyso | Perox | ER | Golgi | PM | Cytosol | Nucleus | |||||
| Expt A |
2 peptides |
3 spectra |
|
0.178 0.093 | 0.258 |
0.000 0.000 | 0.098 |
0.179 0.015 | 0.276 |
0.000 0.000 | 0.000 |
0.291 0.031 | 0.491 |
0.273 0.027 | 0.466 |
0.079 0.000 | 0.157 |
0.000 0.000 | 0.000 |
| 2 spectra, EFSNFLK | 0.072 | 0.000 | 0.067 | 0.000 | 0.285 | 0.401 | 0.175 | 0.000 | ||
| 1 spectrum, MGFTILR | 0.397 | 0.156 | 0.169 | 0.176 | 0.000 | 0.102 | 0.000 | 0.000 |