 7
7peptides
spectra
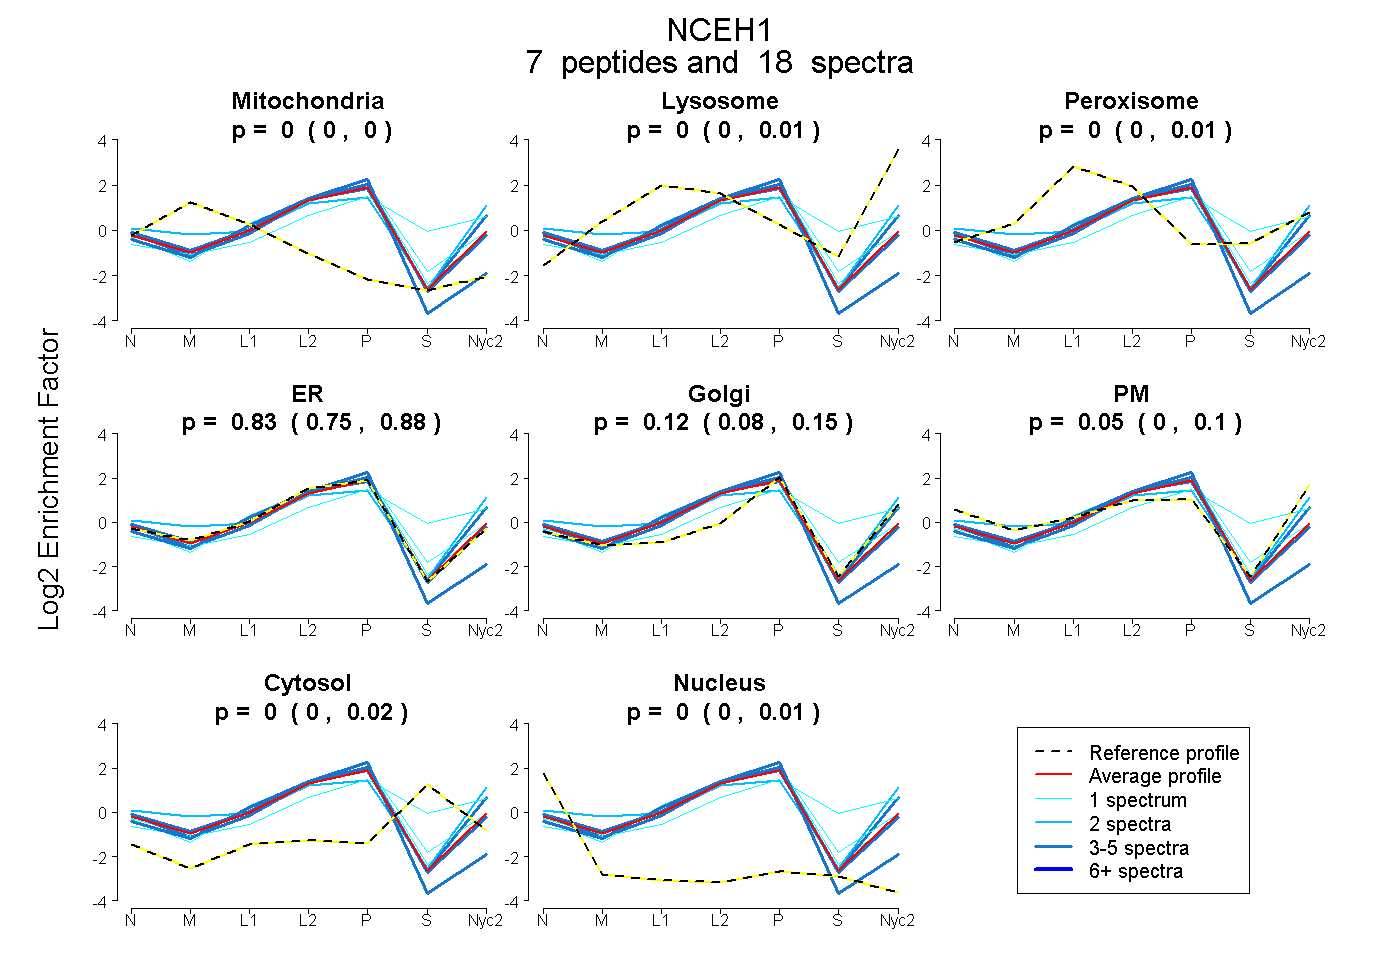
0.000 | 0.000
0.000 | 0.007
0.000 | 0.009
0.752 | 0.884
0.081 | 0.146
0.000 | 0.096
0.000 | 0.017
0.000 | 0.012
1peptide
spectra
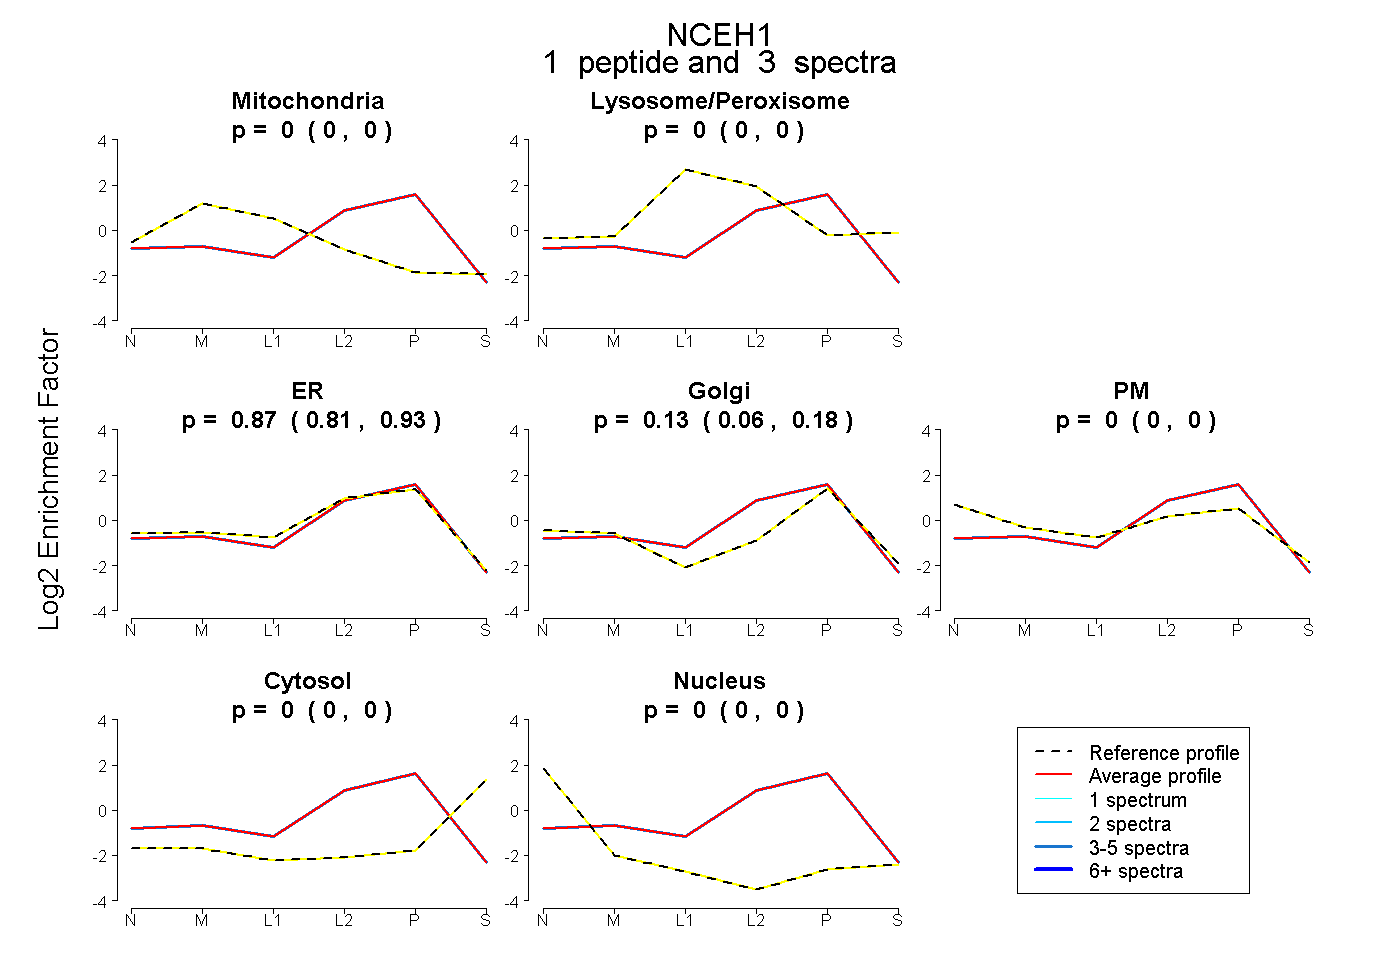
0.000 | 0.000
0.000 | 0.000
0.808 | 0.927
0.063 | 0.182
0.000 | 0.000
0.000 | 0.000
0.000 | 0.000
7peptides
spectra
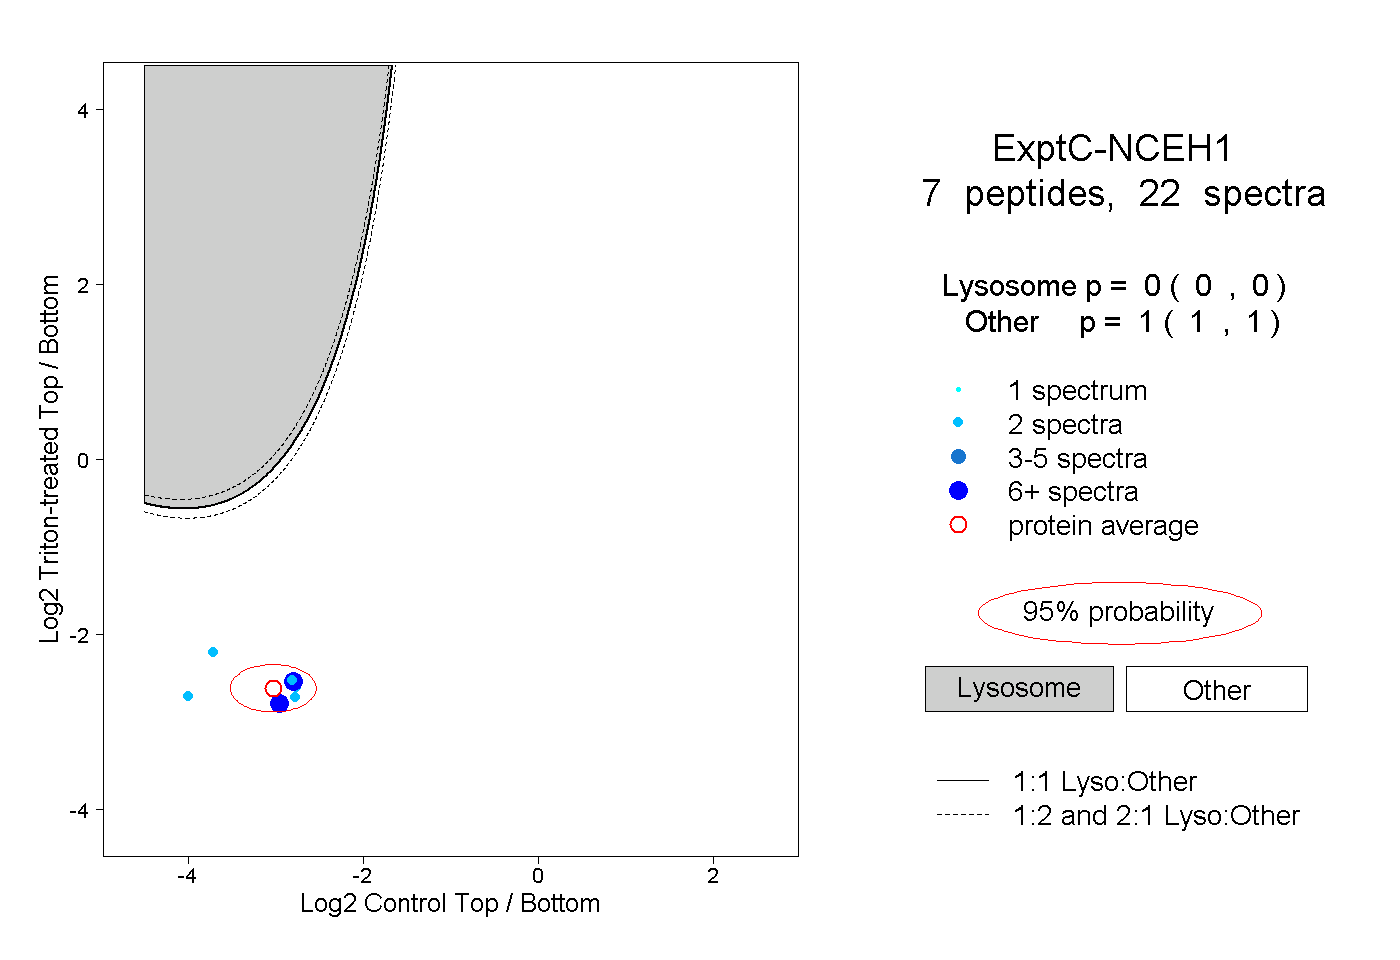
0.000 | 0.000
1.000 | 1.000
1peptide
spectra
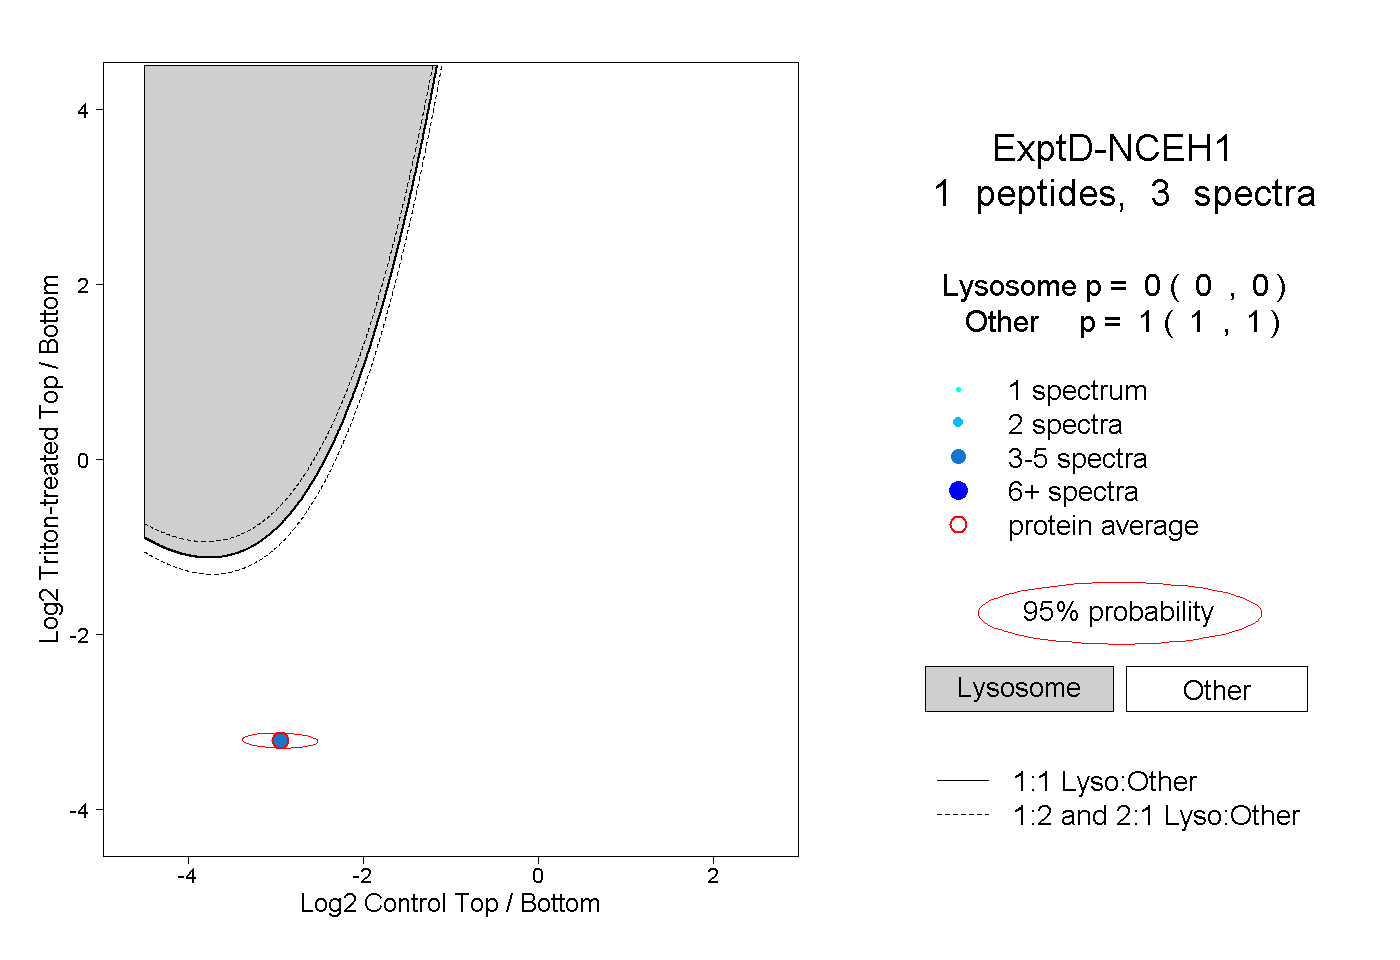
0.000 | 0.000
1.000 | 1.000