 7
7peptides
spectra
0.000 | 0.000
0.000 | 0.007
0.000 | 0.009
0.752 | 0.884
0.081 | 0.146
0.000 | 0.096
0.000 | 0.017
0.000 | 0.012
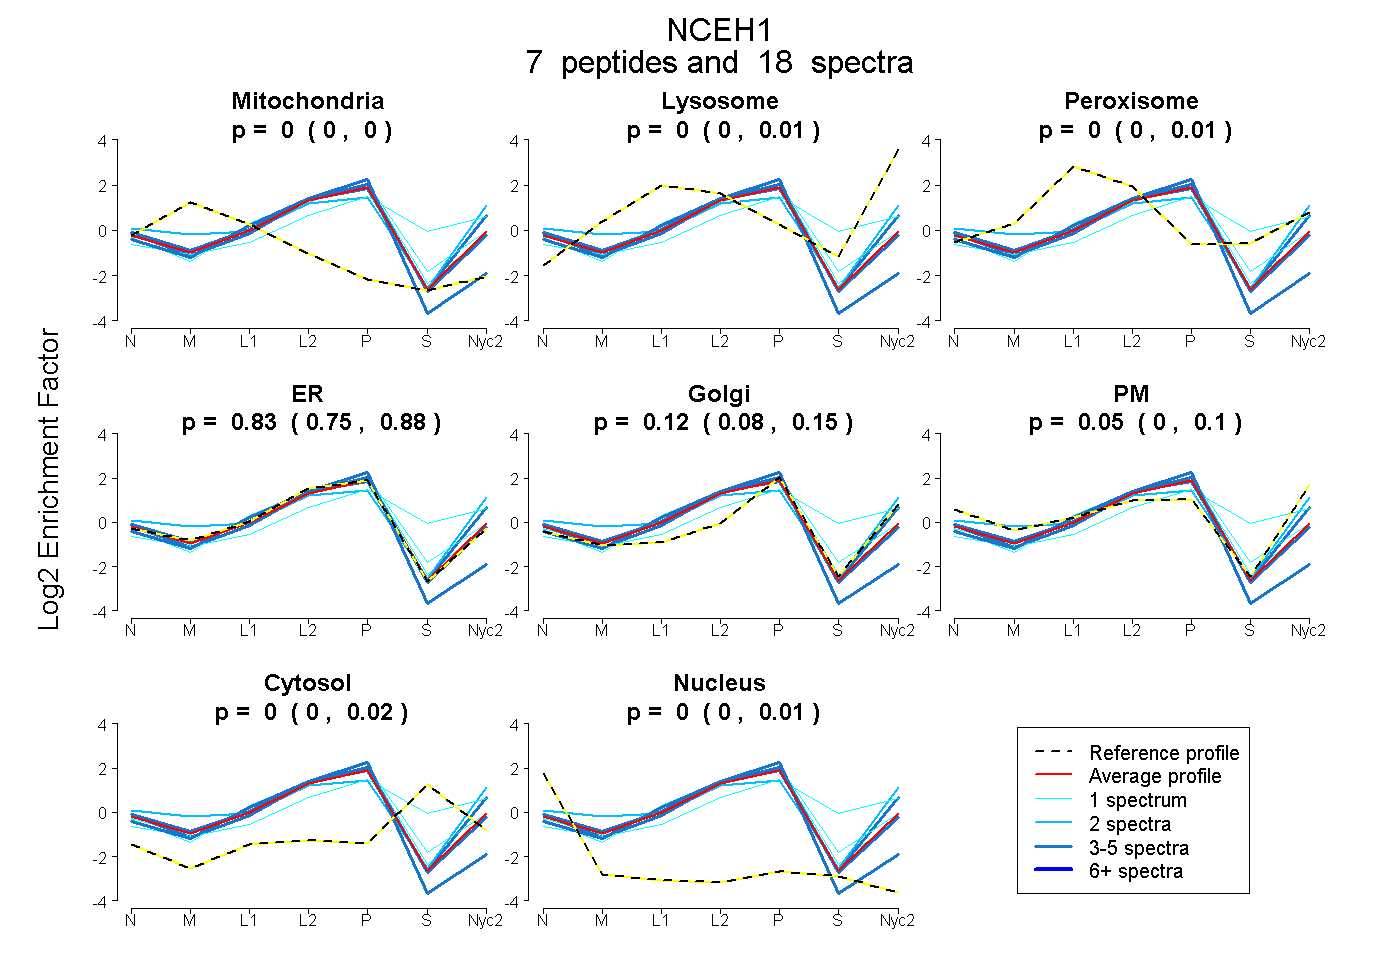
| Plot | Mito | Lyso | Perox | ER | Golgi | PM | Cytosol | Nucleus | |||||
| Expt A |
7 peptides |
18 spectra |
|
0.000 0.000 | 0.000 |
0.000 0.000 | 0.007 |
0.000 0.000 | 0.009 |
0.825 0.752 | 0.884 |
0.122 0.081 | 0.146 |
0.050 0.000 | 0.096 |
0.001 0.000 | 0.017 |
0.002 0.000 | 0.012 |
| 1 spectrum, YFLQPEVLDK | 0.000 | 0.179 | 0.000 | 0.252 | 0.264 | 0.000 | 0.306 | 0.000 | ||
| 5 spectra, VTDTDFDGVEVR | 0.000 | 0.000 | 0.000 | 0.879 | 0.104 | 0.000 | 0.000 | 0.017 | ||
| 1 spectrum, LDWTSLLPSSIK | 0.000 | 0.000 | 0.020 | 0.853 | 0.108 | 0.000 | 0.019 | 0.000 | ||
| 2 spectra, NYKPVLQTIGDAR | 0.003 | 0.034 | 0.000 | 0.314 | 0.069 | 0.580 | 0.000 | 0.000 | ||
| 3 spectra, YWVDYFK | 0.000 | 0.000 | 0.000 | 0.931 | 0.000 | 0.000 | 0.000 | 0.069 | ||
| 5 spectra, LMLLDATFR | 0.000 | 0.025 | 0.000 | 0.593 | 0.110 | 0.272 | 0.000 | 0.000 | ||
| 1 spectrum, TYILTCEHDVLR | 0.000 | 0.050 | 0.000 | 0.868 | 0.000 | 0.000 | 0.082 | 0.000 |
| Plot | Mito | Lyso or Perox | ER | Golgi | PM | Cytosol | Nucleus | ||||||
| Expt B |
1 peptide |
3 spectra |
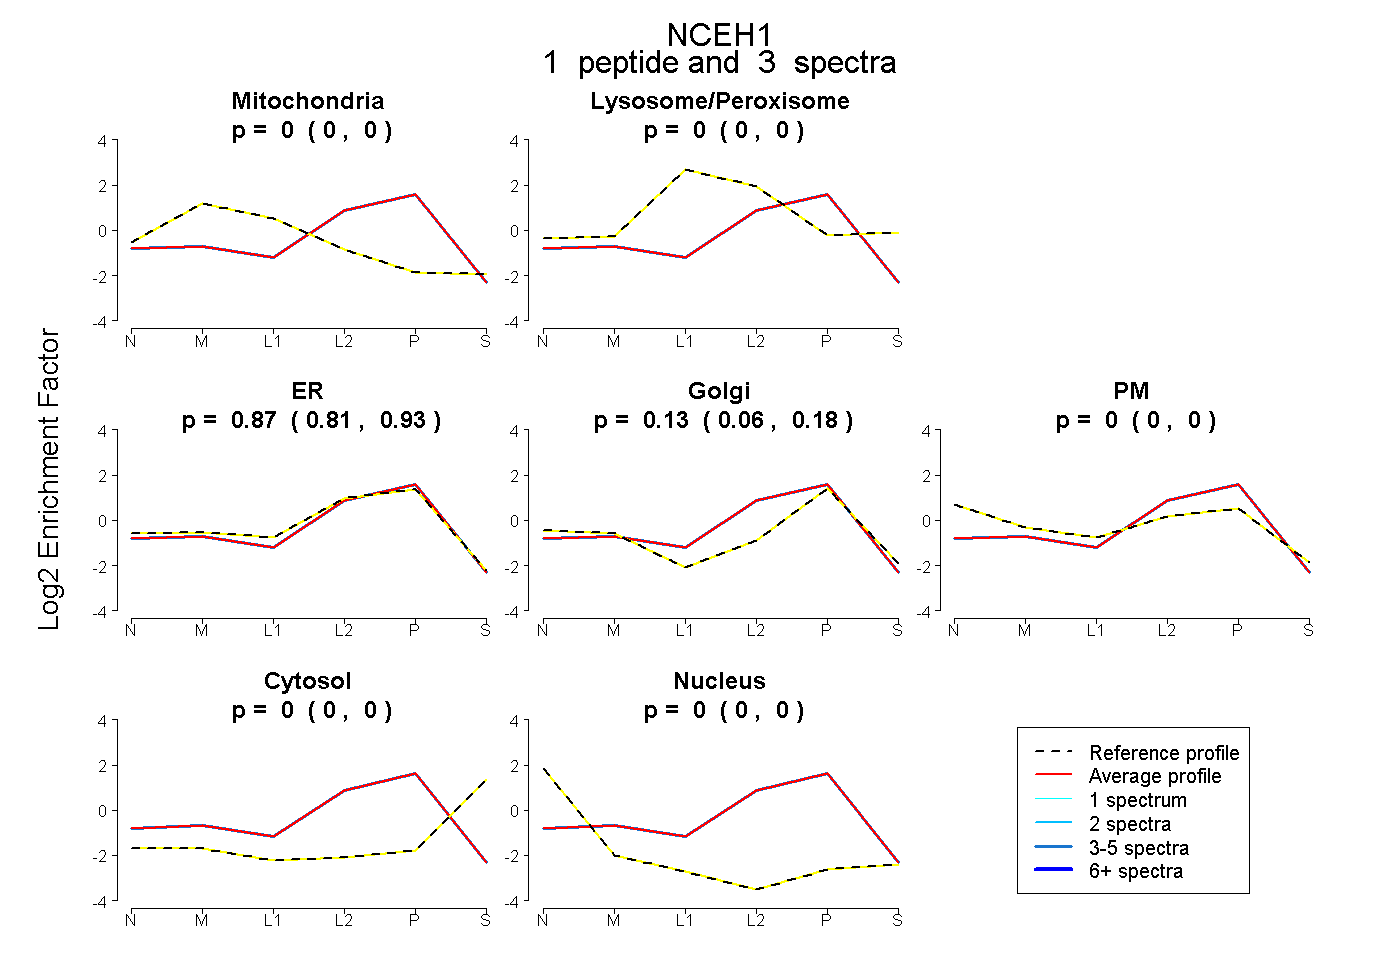 |
0.000 0.000 | 0.000 |
0.000 0.000 | 0.000 |
0.872 0.808 | 0.927 |
0.128 0.063 | 0.182 |
0.000 0.000 | 0.000 |
0.000 0.000 | 0.000 |
0.000 0.000 | 0.000 |
|||
| Plot | Lyso | Other | |||||||||||
| Expt C |
7 peptides |
22 spectra |
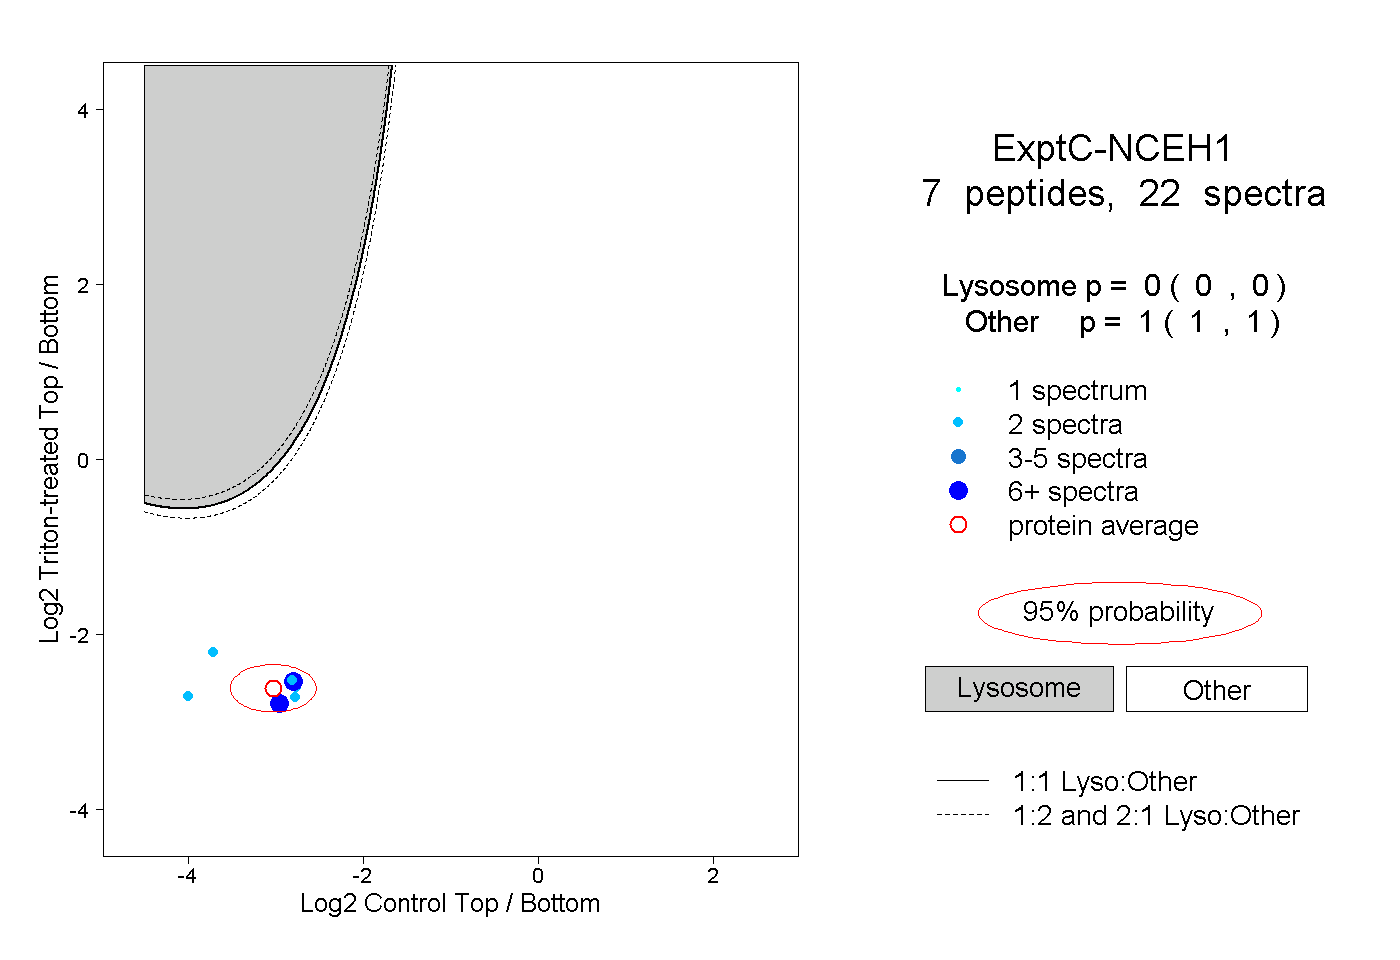 |
0.000 0.000 | 0.000 |
1.000 1.000 | 1.000 |
||||||||
| Plot | Lyso | Other | |||||||||||
| Expt D |
1 peptide |
3 spectra |
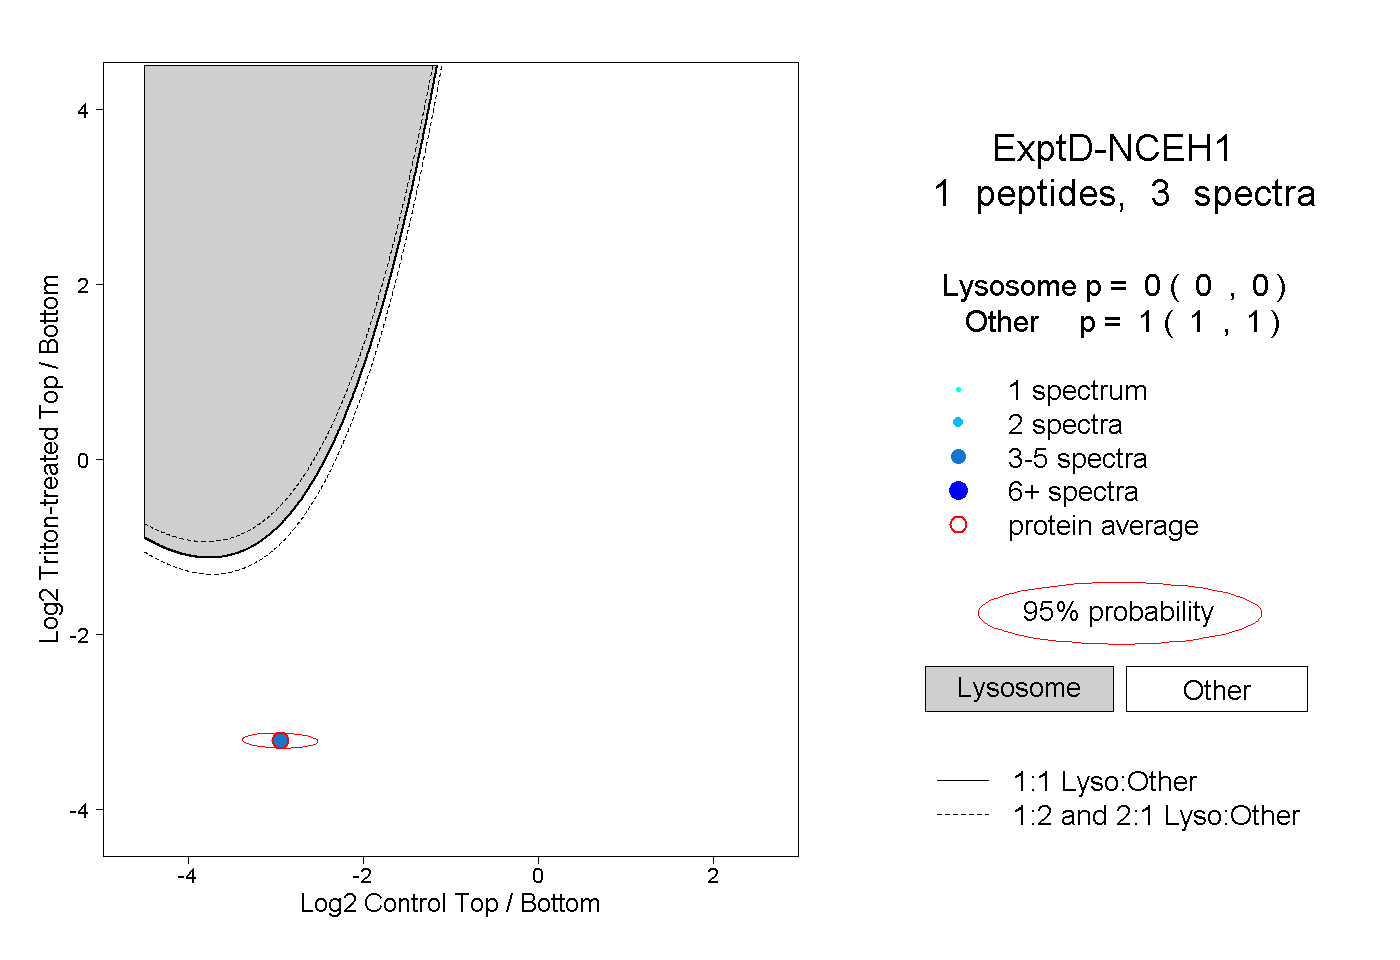 |
0.000 0.000 | 0.000 |
1.000 1.000 | 1.000 |