 3
3peptides
spectra

0.143 | 0.343
0.000 | 0.141
0.002 | 0.324
0.000 | 0.235
0.000 | 0.134
0.192 | 0.579
0.000 | 0.020
0.000 | 0.004
1peptide
spectra
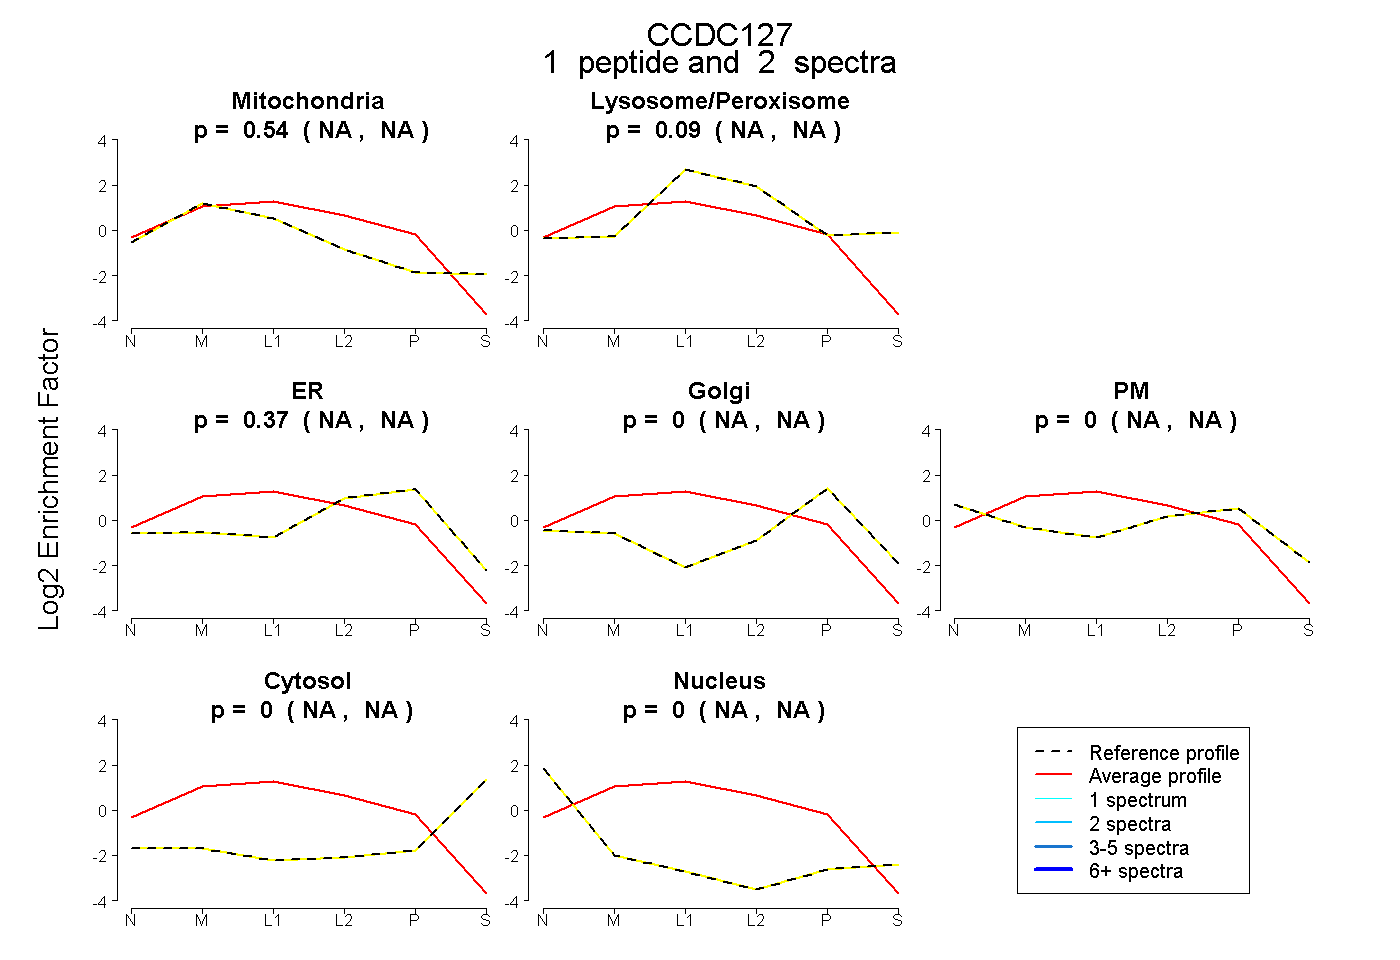
NA | NA
NA | NA
NA | NA
NA | NA
NA | NA
NA | NA
NA | NA
8peptides
spectra

0.000 | 0.017
0.982 | 1.000
1peptide
spectra
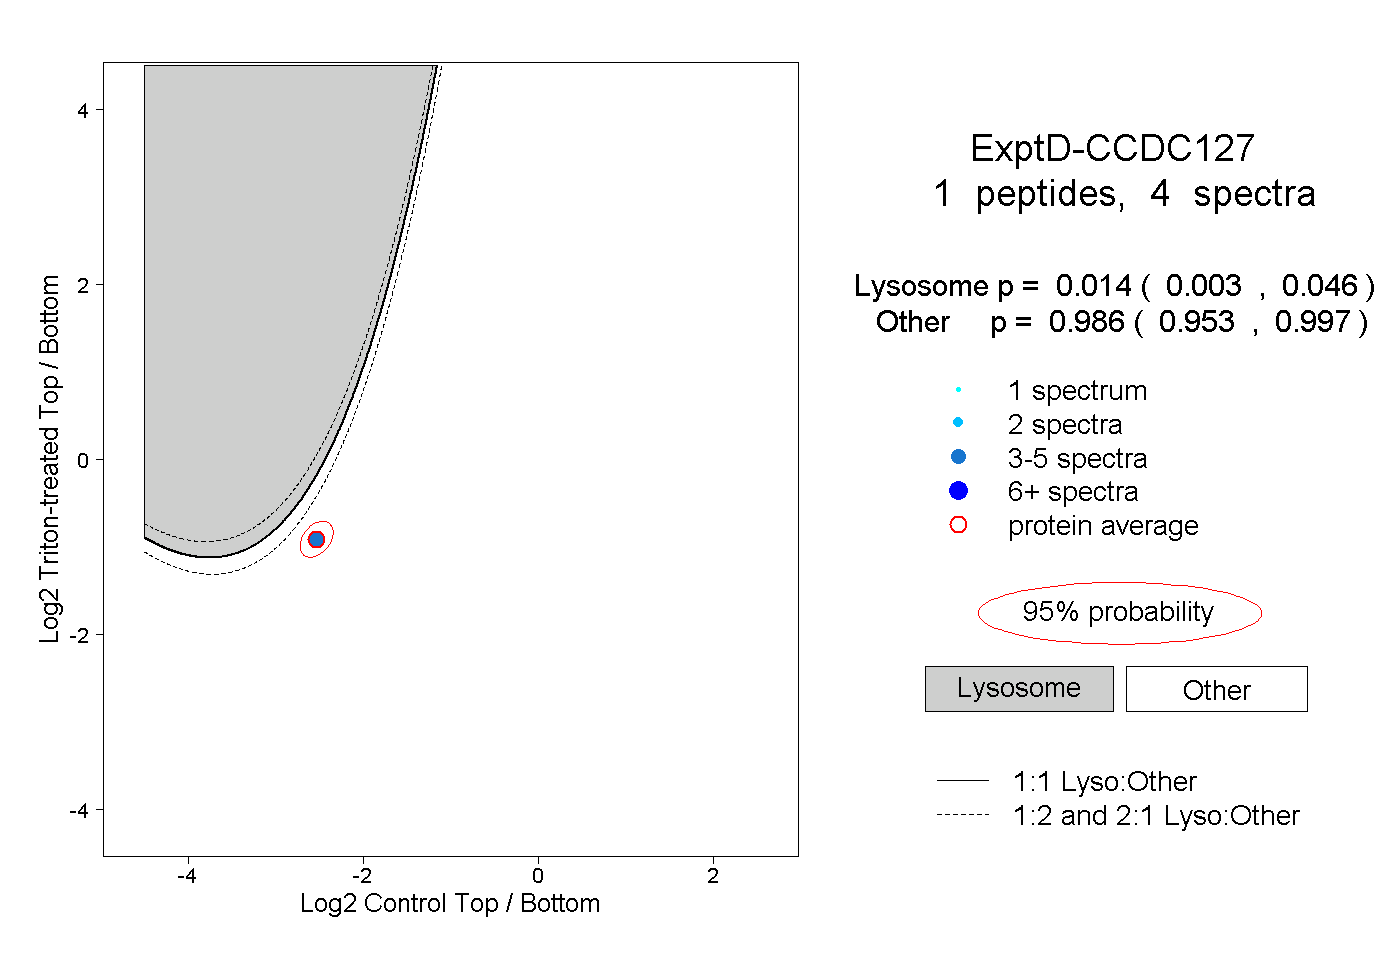
0.003 | 0.046
0.953 | 0.997