3
3peptides
spectra
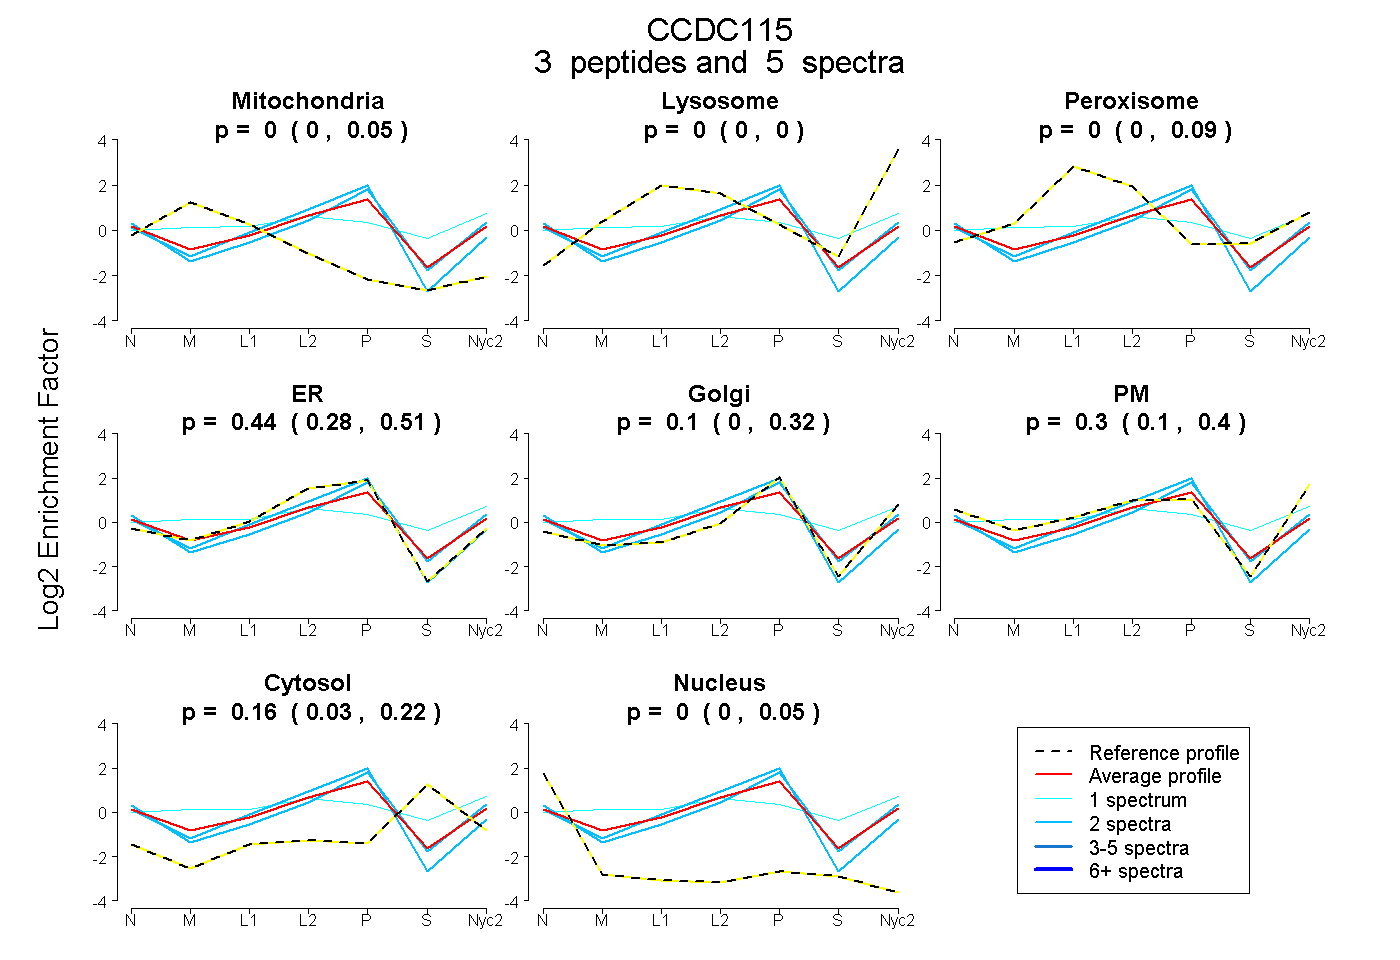
0.000 | 0.048
0.000 | 0.000
0.000 | 0.091
0.280 | 0.507
0.000 | 0.316
0.104 | 0.399
0.026 | 0.220
0.000 | 0.052
3peptides
spectra
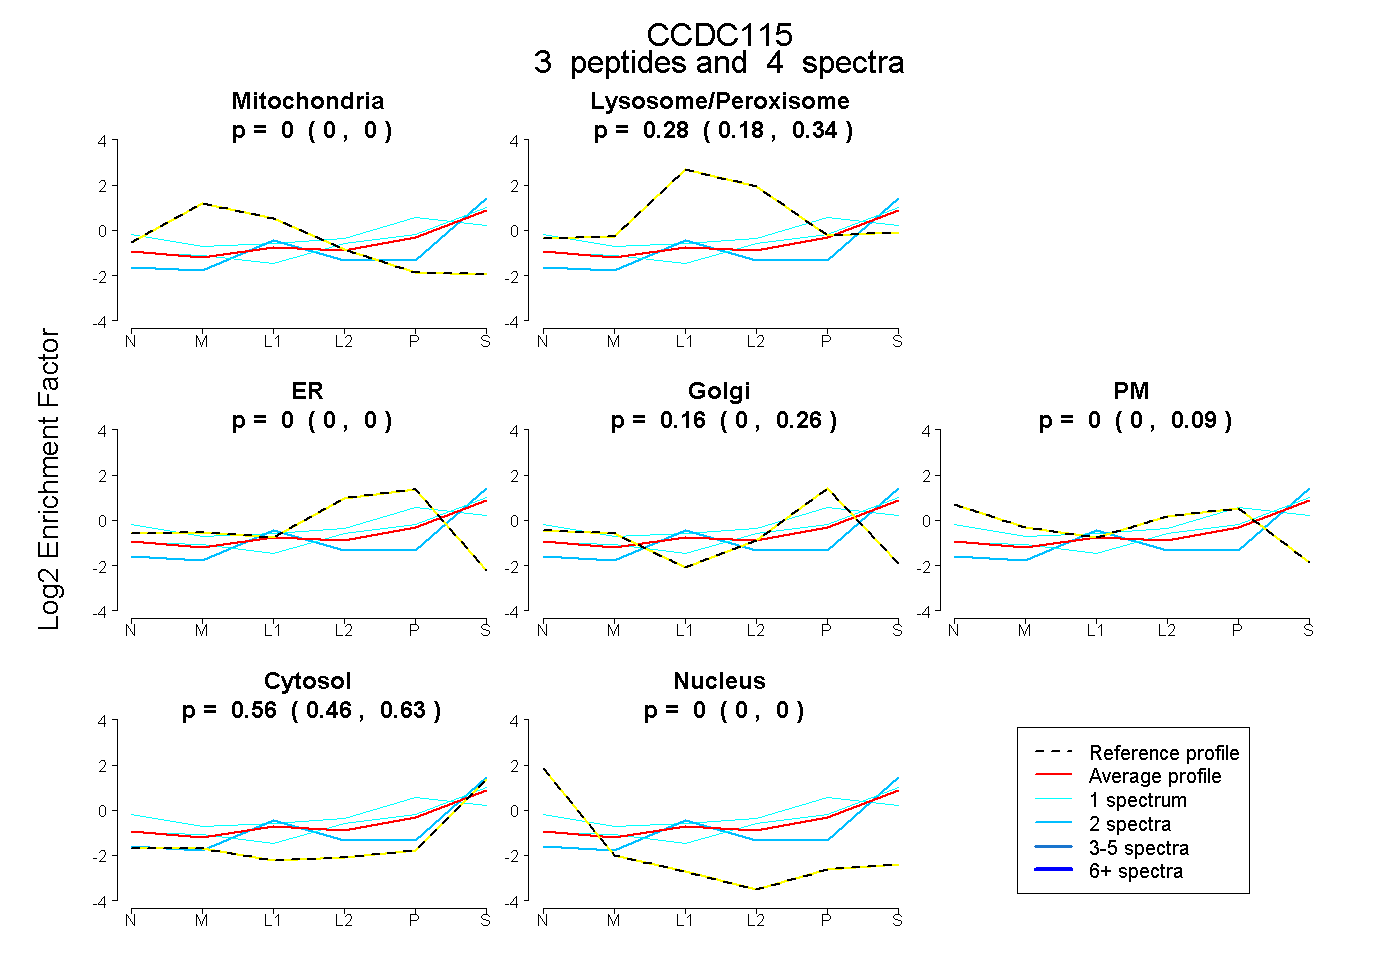
0.000 | 0.000
0.184 | 0.344
0.000 | 0.000
0.000 | 0.261
0.000 | 0.094
0.463 | 0.634
0.000 | 0.000