3
3peptides
spectra
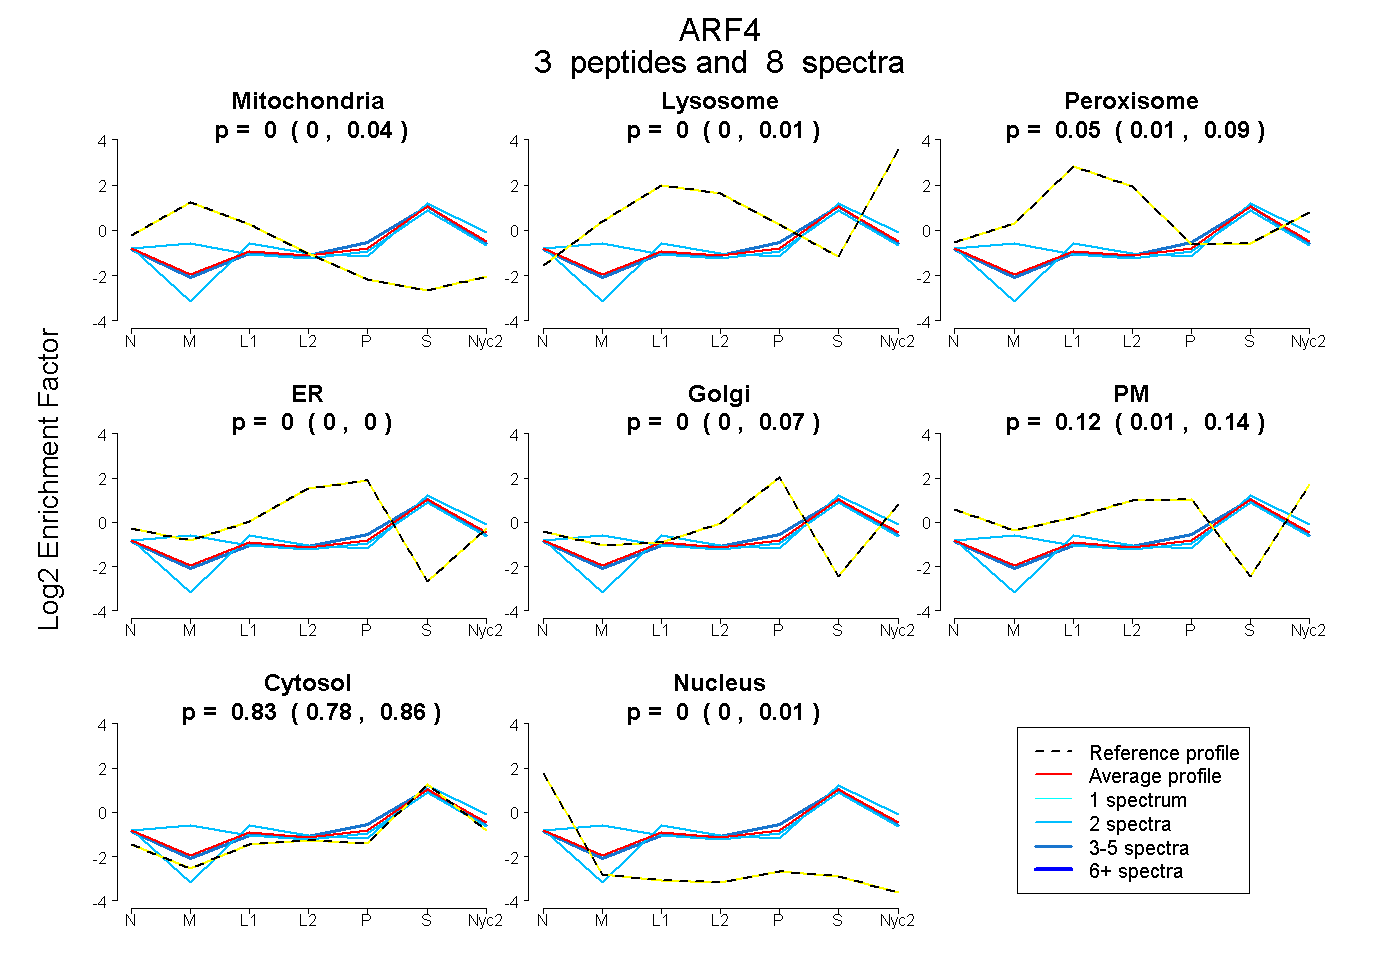
0.000 | 0.043
0.000 | 0.015
0.008 | 0.087
0.000 | 0.000
0.000 | 0.067
0.013 | 0.137
0.777 | 0.858
0.000 | 0.010
2peptides
spectra
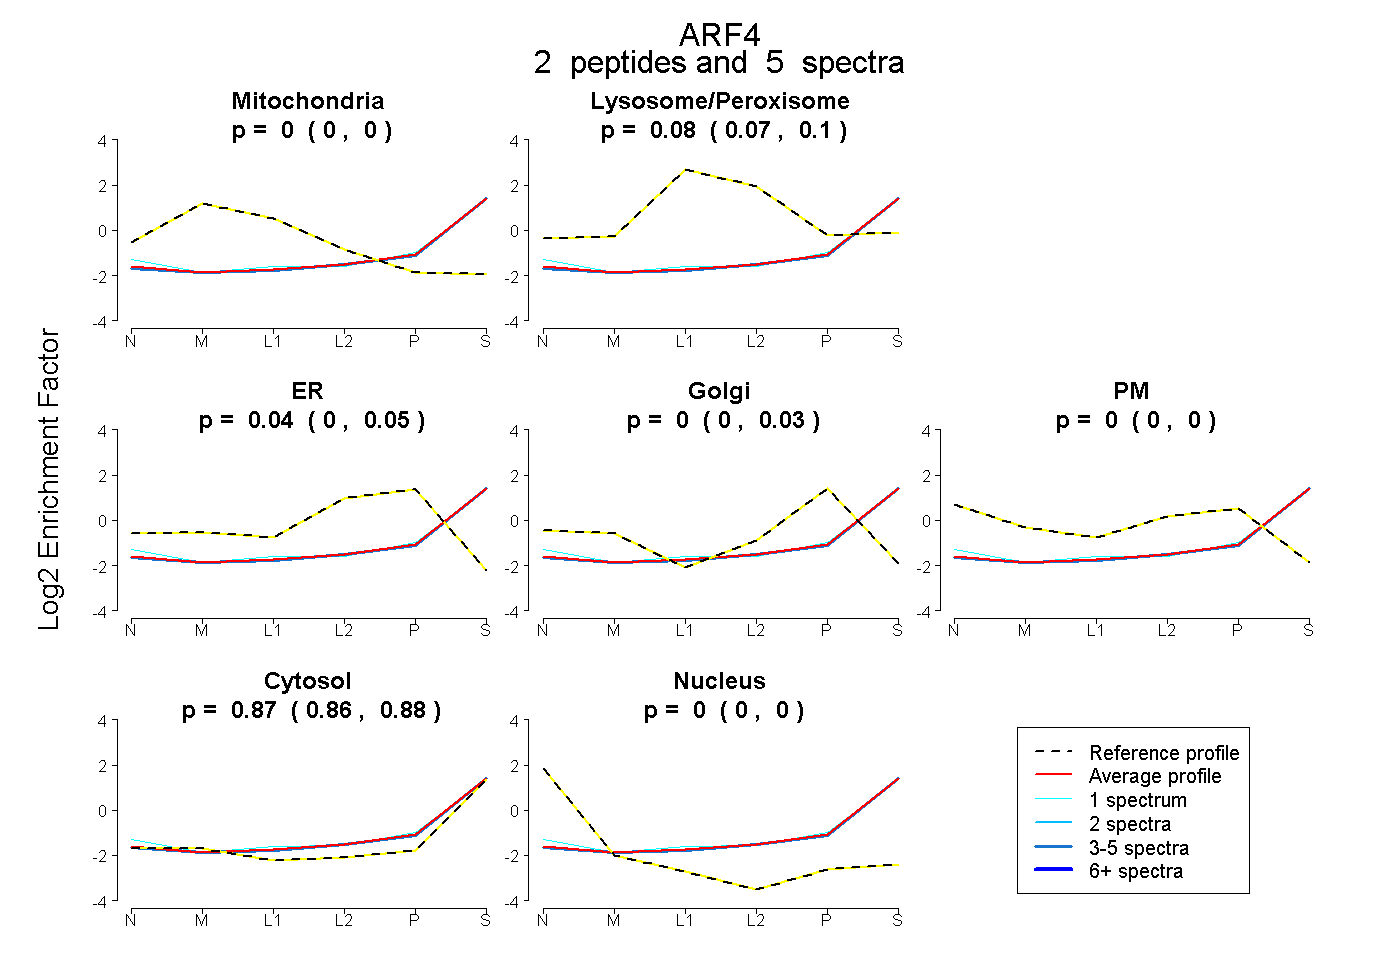
0.000 | 0.000
0.067 | 0.103
0.000 | 0.055
0.000 | 0.033
0.000 | 0.000
0.856 | 0.879
0.000 | 0.000
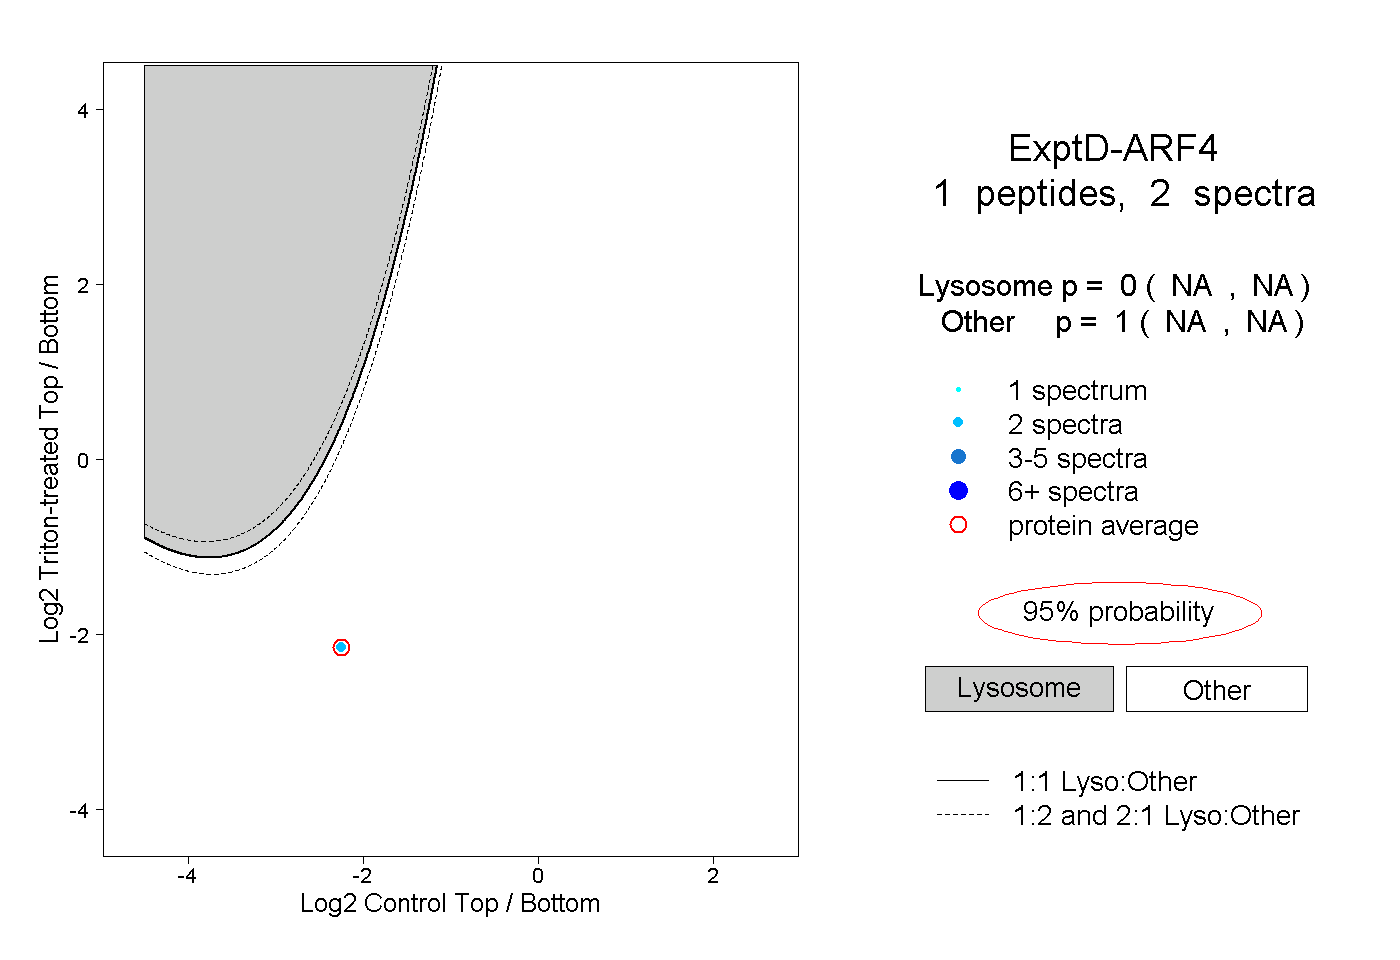
2peptides
spectra
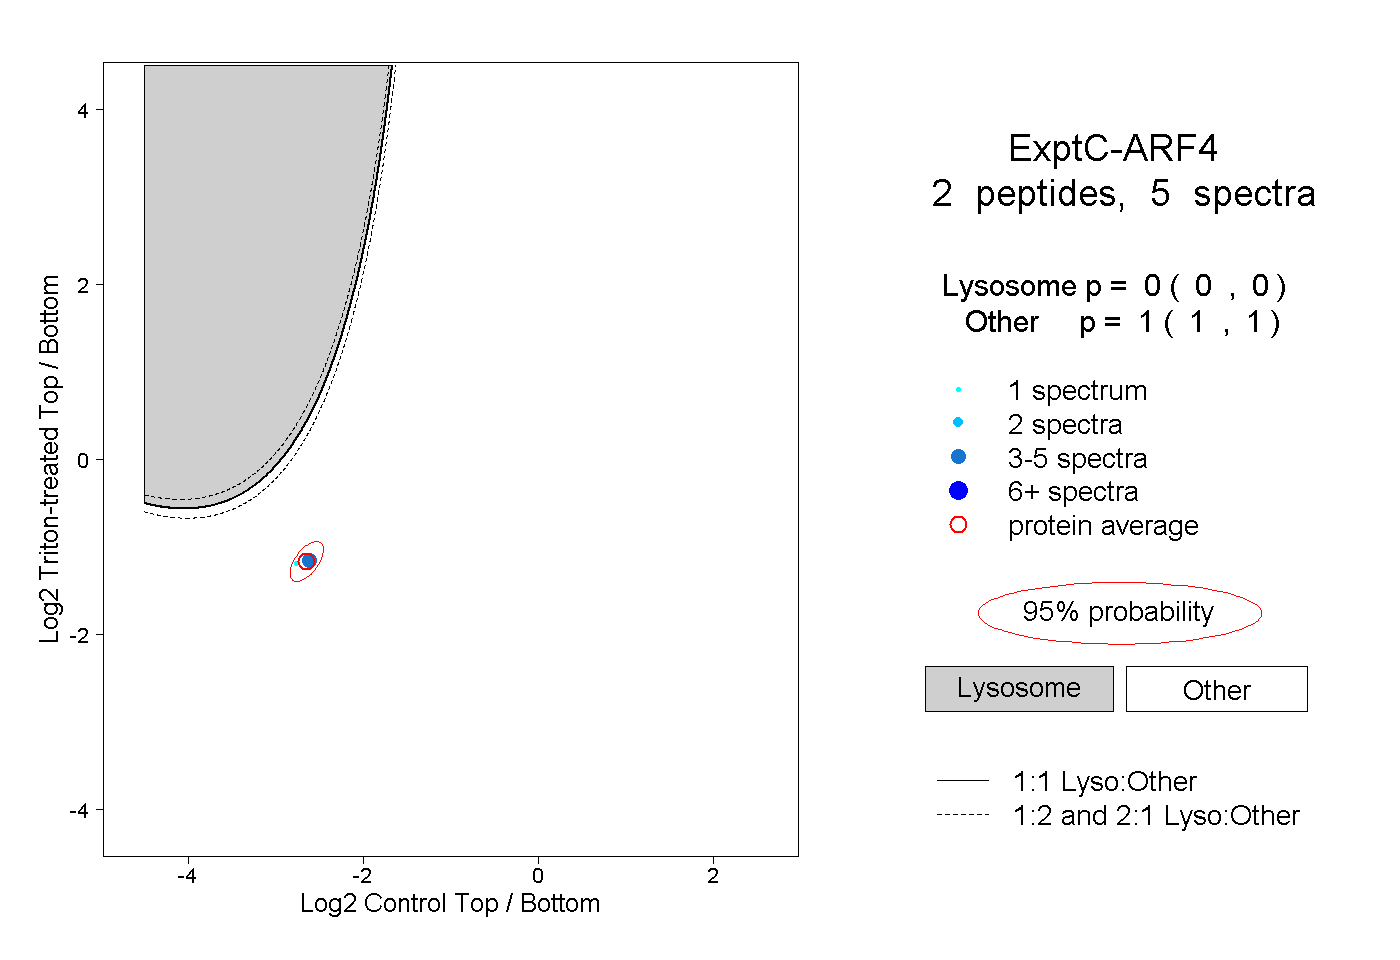
0.000 | 0.000
1.000 | 1.000