 20
20peptides
spectra
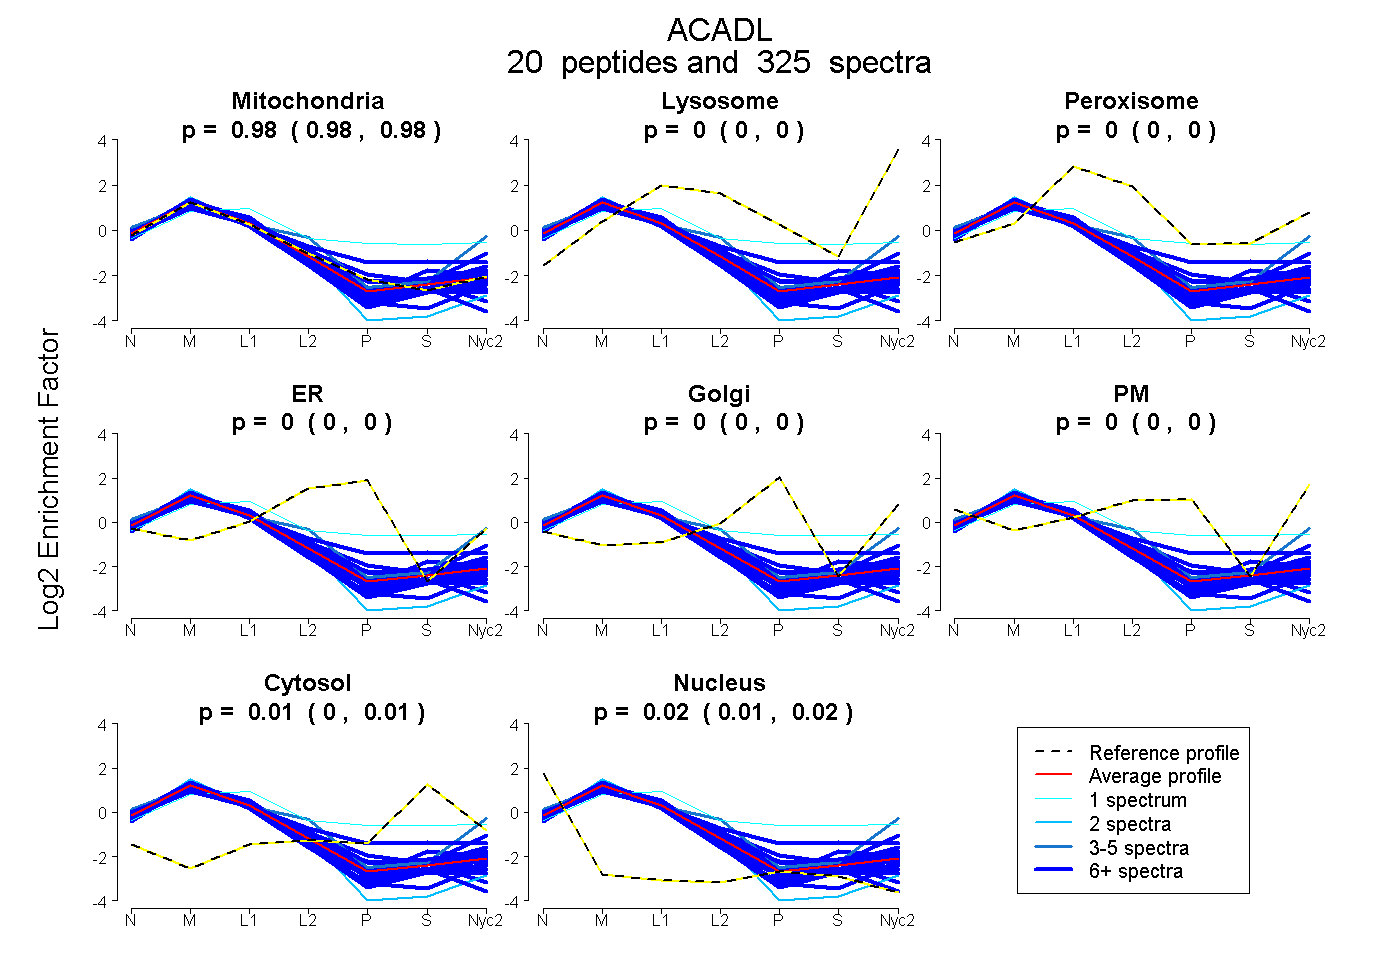
0.977 | 0.979
0.000 | 0.000
0.000 | 0.000
0.000 | 0.000
0.000 | 0.000
0.000 | 0.000
0.005 | 0.009
0.014 | 0.017
17peptides
spectra
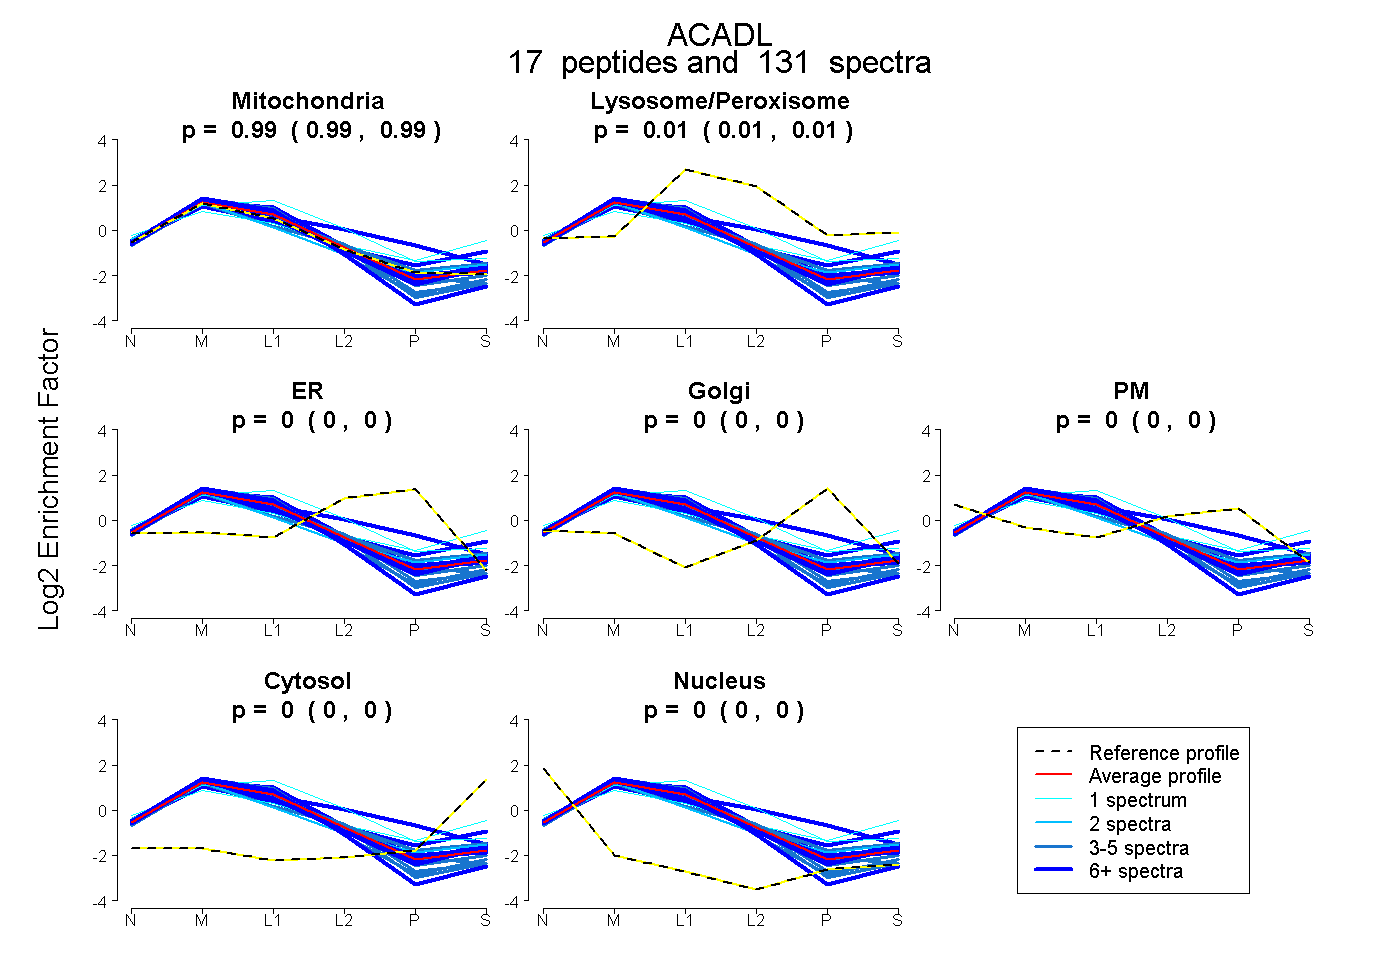
0.986 | 0.992
0.007 | 0.014
0.000 | 0.000
0.000 | 0.000
0.000 | 0.000
0.000 | 0.000
0.000 | 0.000
20peptides
spectra
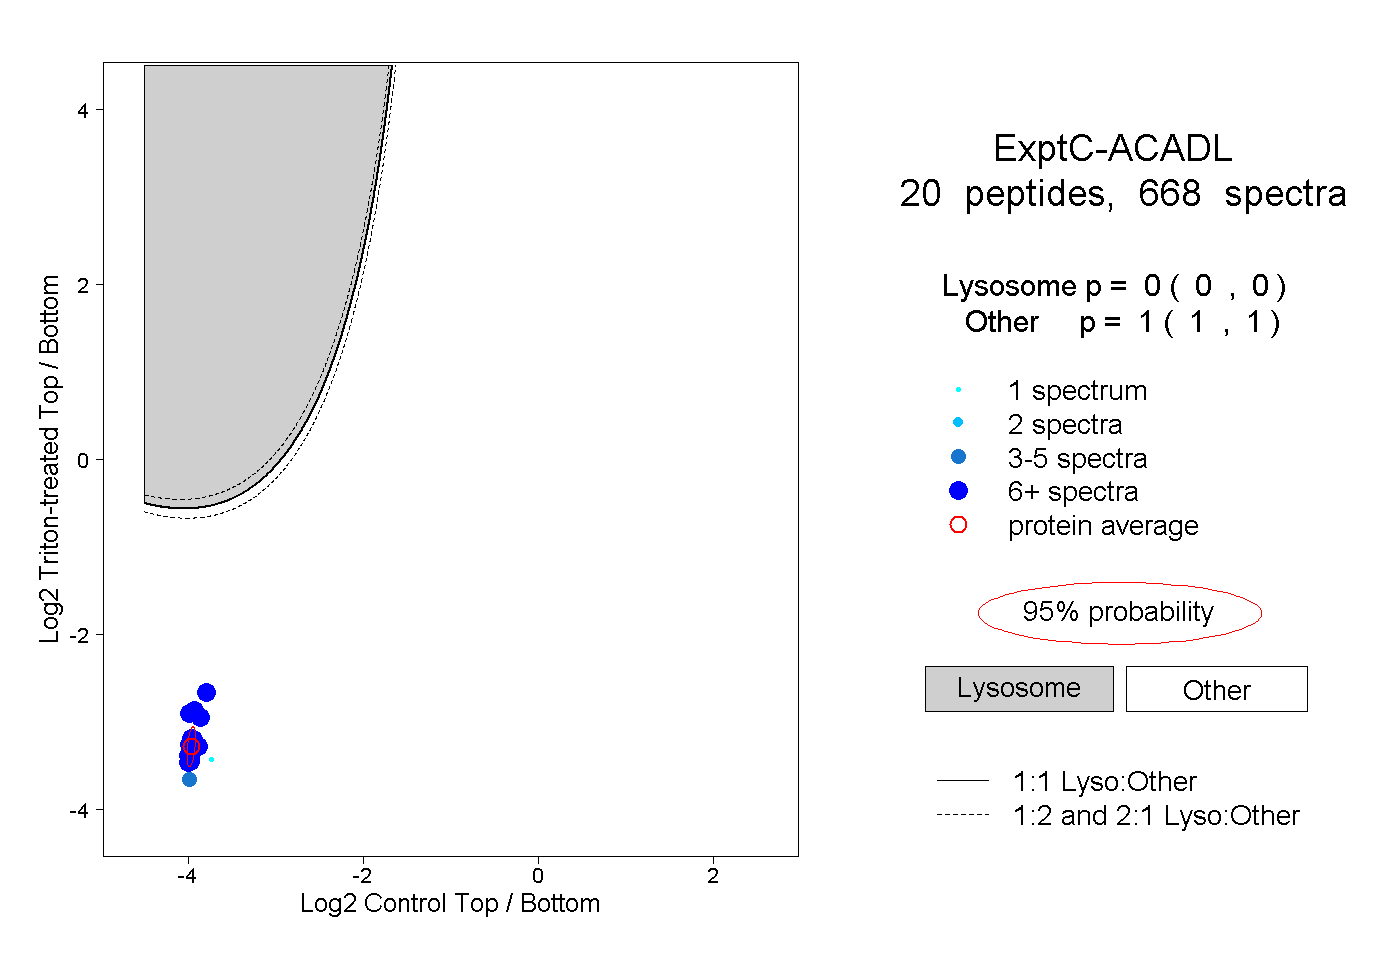
0.000 | 0.000
1.000 | 1.000
13peptides
spectra
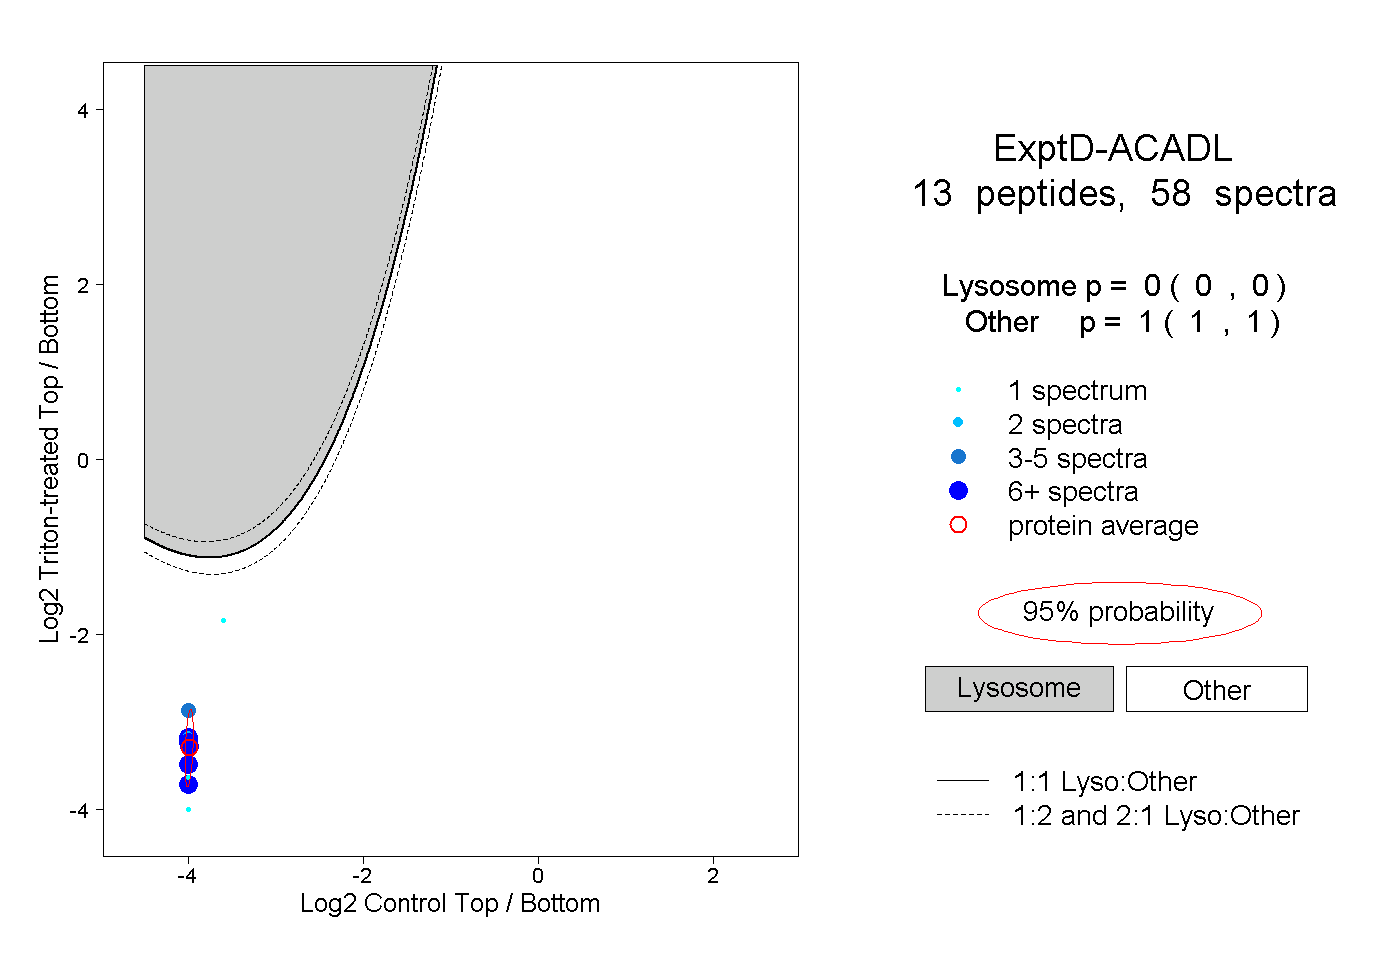
0.000 | 0.000
1.000 | 1.000