 4
4peptides
spectra
0.000 | 0.000
0.000 | 0.000
0.066 | 0.137
0.781 | 0.892
0.000 | 0.000
0.000 | 0.067
0.000 | 0.033
0.000 | 0.048
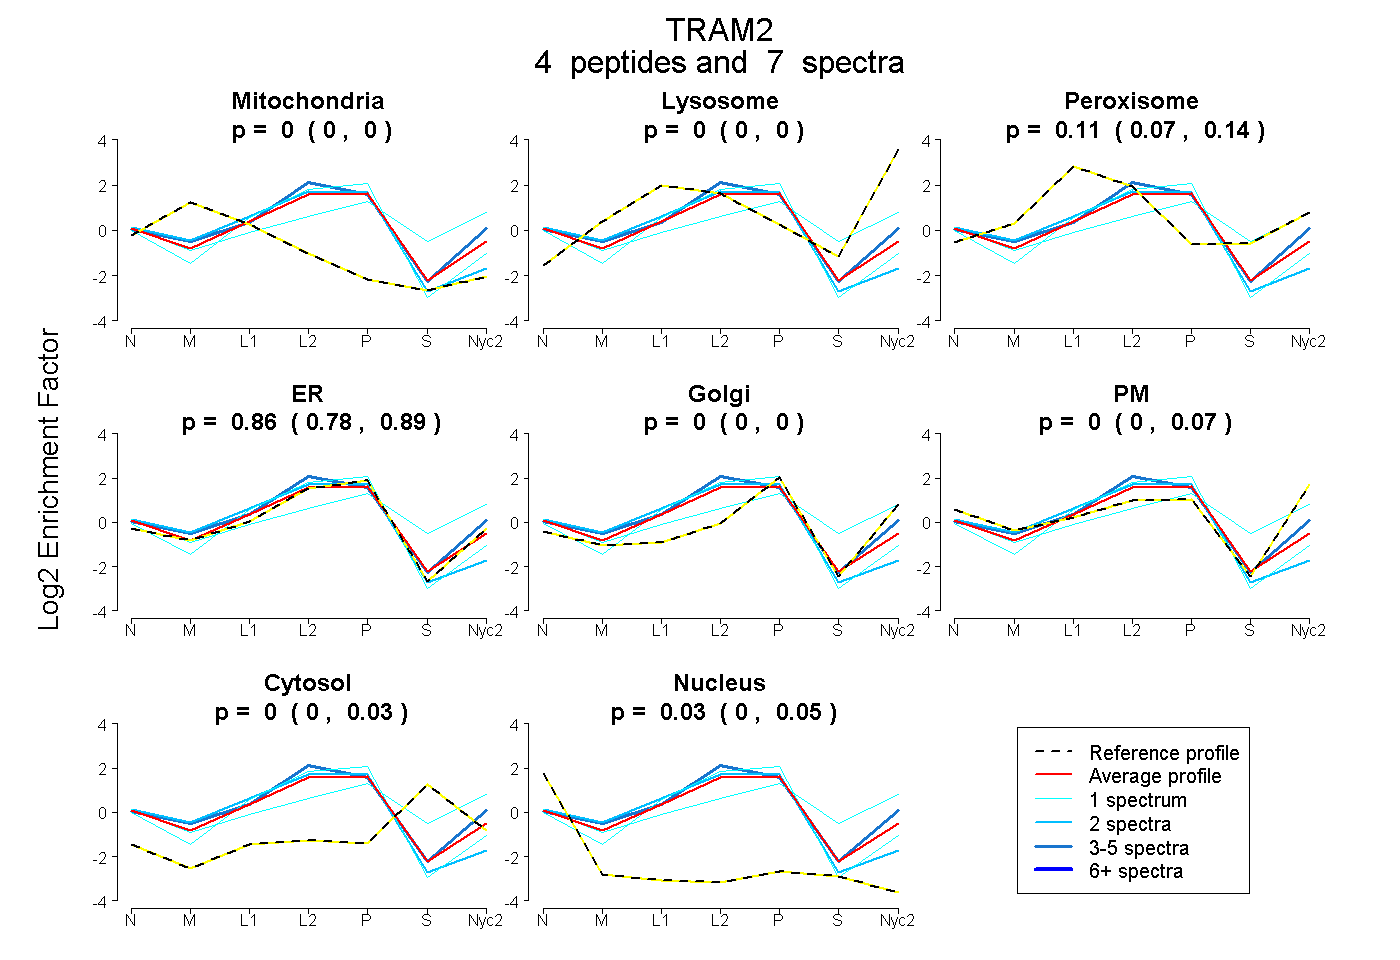
| Plot | Mito | Lyso | Perox | ER | Golgi | PM | Cytosol | Nucleus | |||||
| Expt A |
4 peptides |
7 spectra |
|
0.000 0.000 | 0.000 |
0.000 0.000 | 0.000 |
0.111 0.066 | 0.137 |
0.860 0.781 | 0.892 |
0.000 0.000 | 0.000 |
0.000 0.000 | 0.067 |
0.000 0.000 | 0.033 |
0.029 0.000 | 0.048 |
| 1 spectrum, VSAVPR | 0.000 | 0.000 | 0.000 | 0.990 | 0.000 | 0.000 | 0.000 | 0.010 | ||
| 1 spectrum, VSAPVR | 0.000 | 0.000 | 0.158 | 0.039 | 0.274 | 0.323 | 0.207 | 0.000 | ||
| 2 spectra, GNFNTLPCR | 0.123 | 0.000 | 0.000 | 0.877 | 0.000 | 0.000 | 0.000 | 0.000 | ||
| 3 spectra, FIHSQLR | 0.000 | 0.000 | 0.141 | 0.771 | 0.000 | 0.088 | 0.000 | 0.000 |
| Plot | Lyso | Other | |||||||||||
| Expt C |
2 peptides |
4 spectra |
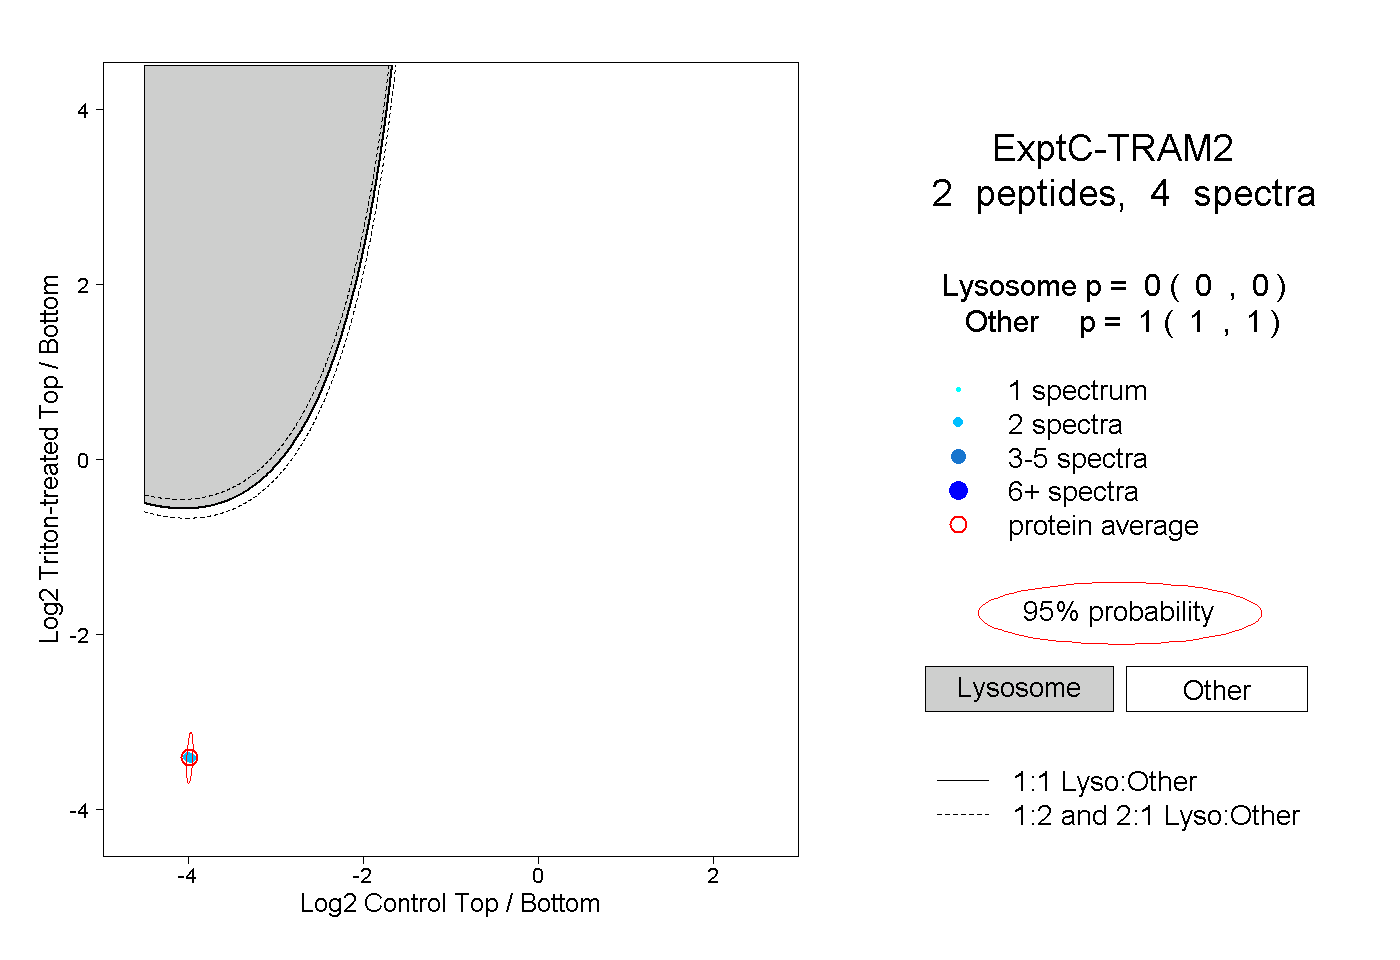 |
0.000 0.000 | 0.000 |
1.000 1.000 | 1.000 |
||||||||
| Plot | Lyso | Other | |||||||||||
| Expt D |
1 peptide |
3 spectra |
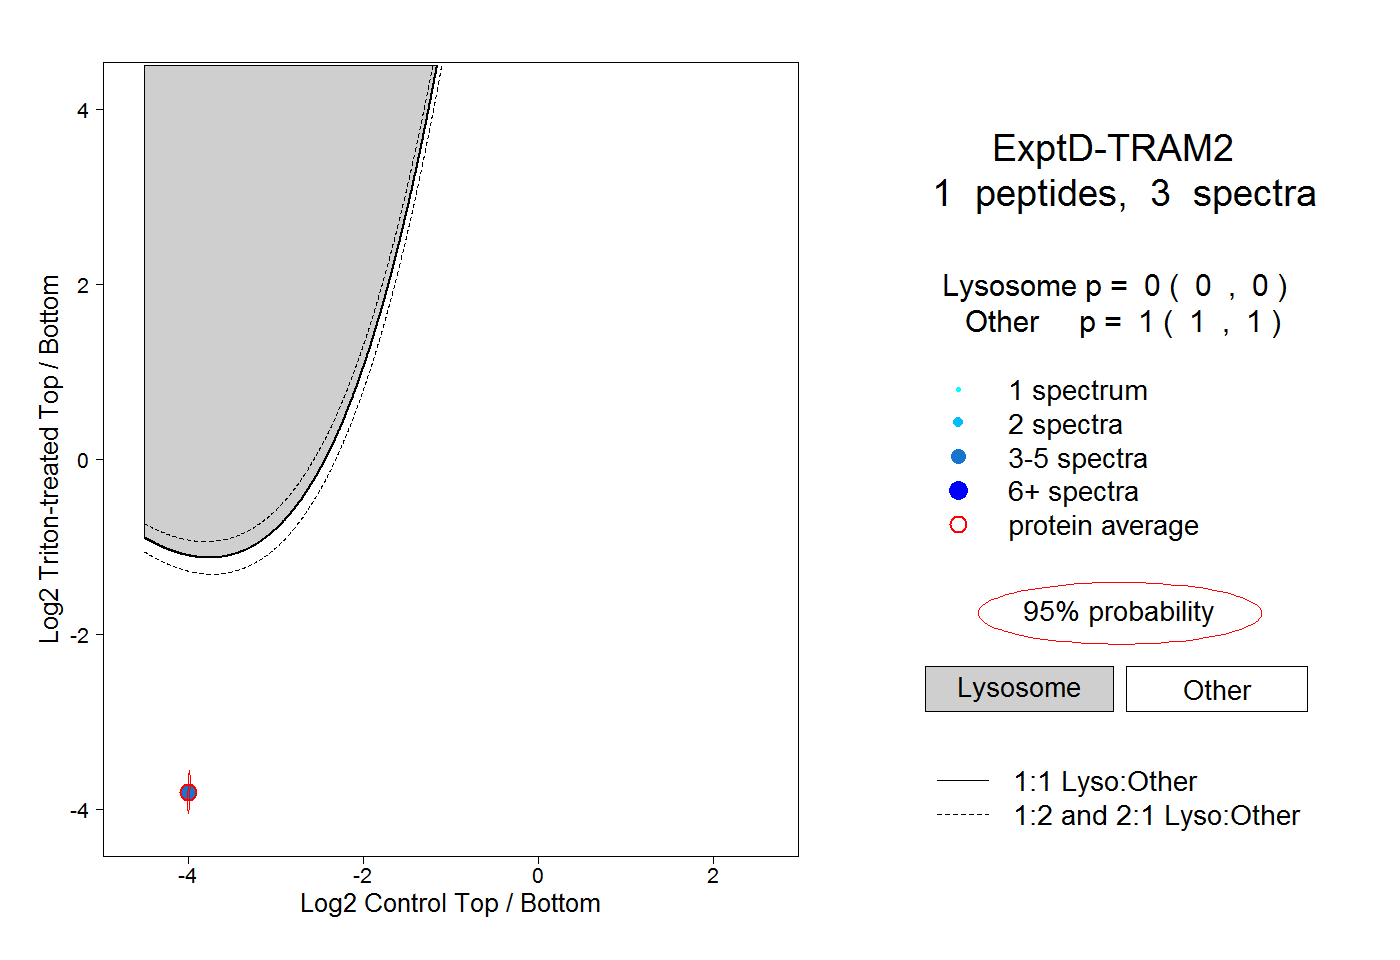 |
0.000 0.000 | 0.000 |
1.000 1.000 | 1.000 |