 6
6peptides
spectra
0.000 | 0.000
0.000 | 0.000
0.000 | 0.000
0.000 | 0.000
0.000 | 0.045
0.374 | 0.425
0.411 | 0.439
0.136 | 0.158
2peptides
spectra
NA | NA
NA | NA
NA | NA
NA | NA
NA | NA
NA | NA
NA | NA
| Plot | Mito | Lyso | Perox | ER | Golgi | PM | Cytosol | Nucleus | |||||
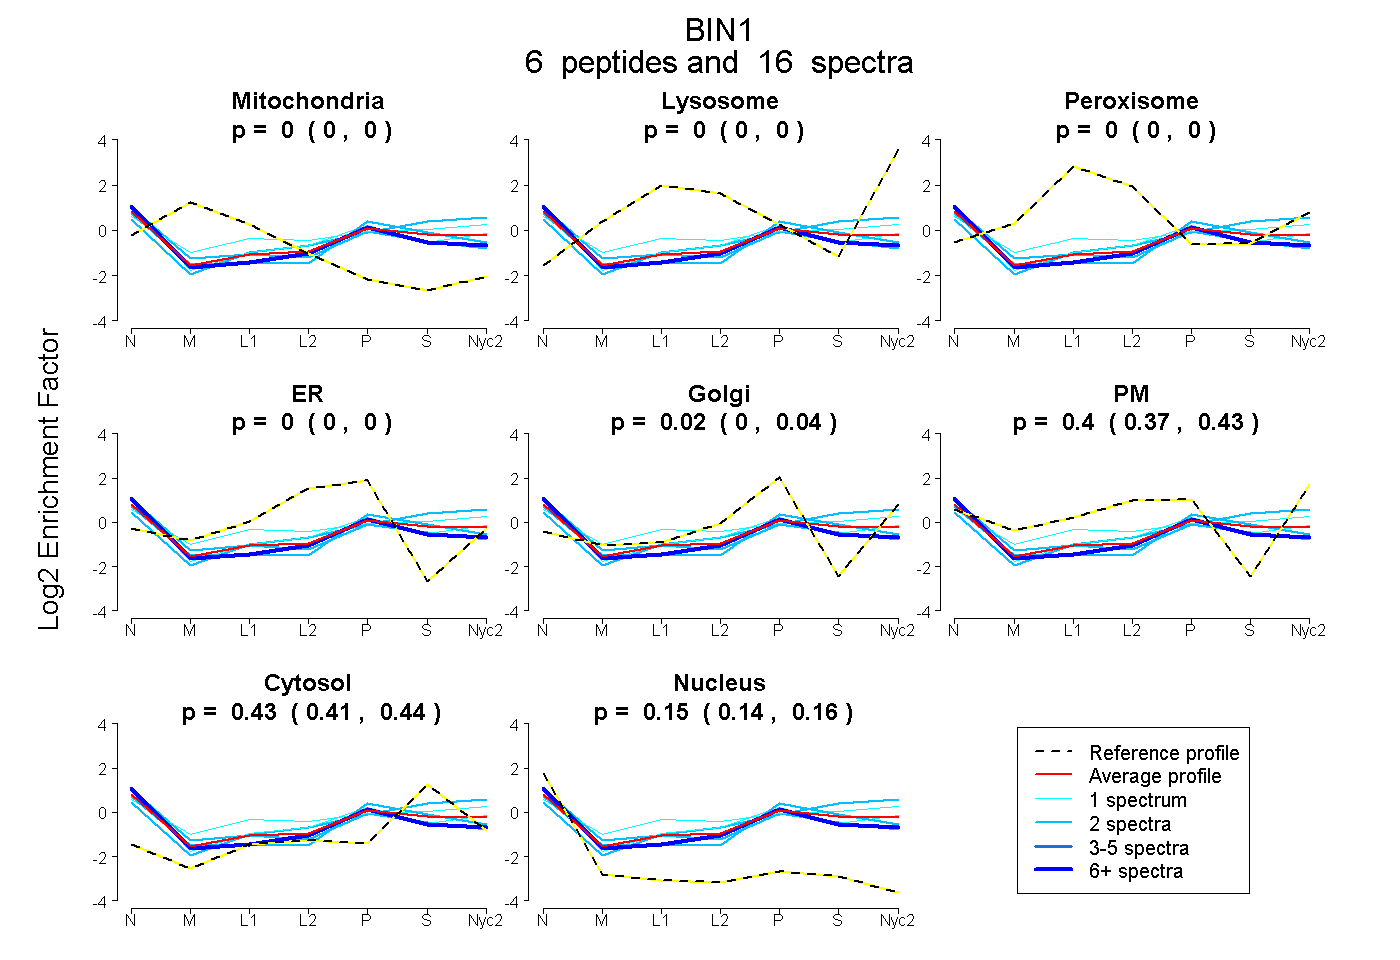
| Expt A |
6 peptides |
16 spectra |
|
0.000 0.000 | 0.000 |
0.000 0.000 | 0.000 |
0.000 0.000 | 0.000 |
0.000 0.000 | 0.000 |
0.022 0.000 | 0.045 |
0.403 0.374 | 0.425 |
0.427 0.411 | 0.439 |
0.148 0.136 | 0.158 |
||
| Plot | Mito | Lyso or Perox | ER | Golgi | PM | Cytosol | Nucleus | ||||||
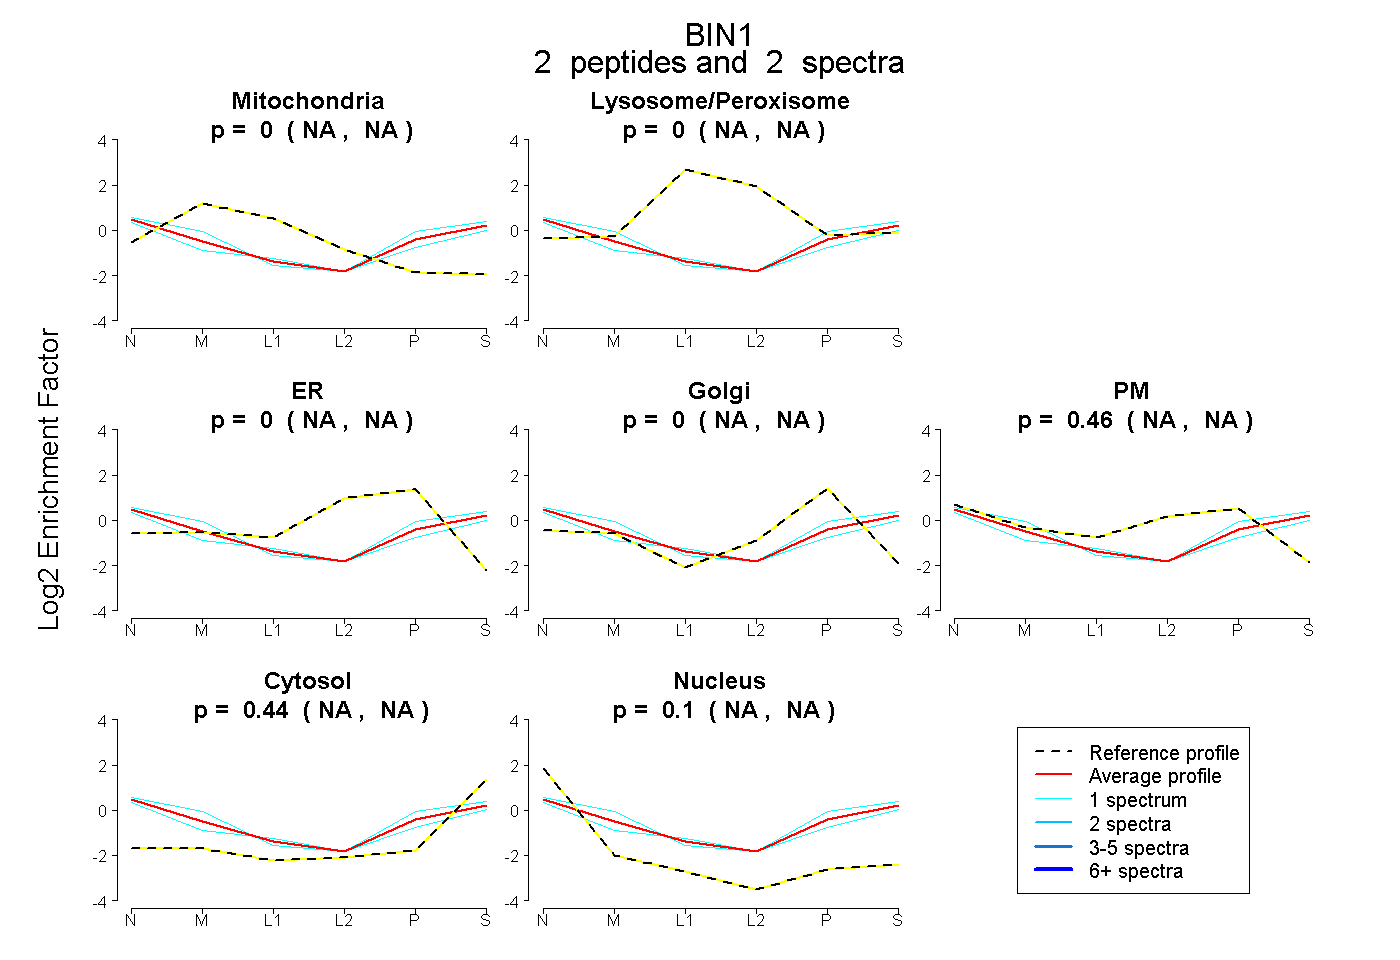
| Expt B |
2 peptides |
2 spectra |
|
0.000 NA | NA |
0.000 NA | NA |
0.000 NA | NA |
0.000 NA | NA |
0.459 NA | NA |
0.437 NA | NA |
0.105 NA | NA |
| 1 spectrum, GVFPENFTER | 0.000 | 0.000 | 0.000 | 0.000 | 0.468 | 0.477 | 0.055 | |||
| 1 spectrum, LVDYDSAR | 0.107 | 0.000 | 0.000 | 0.000 | 0.368 | 0.377 | 0.148 |
| Plot | Lyso | Other | |||||||||||
| Expt C |
7 peptides |
20 spectra |
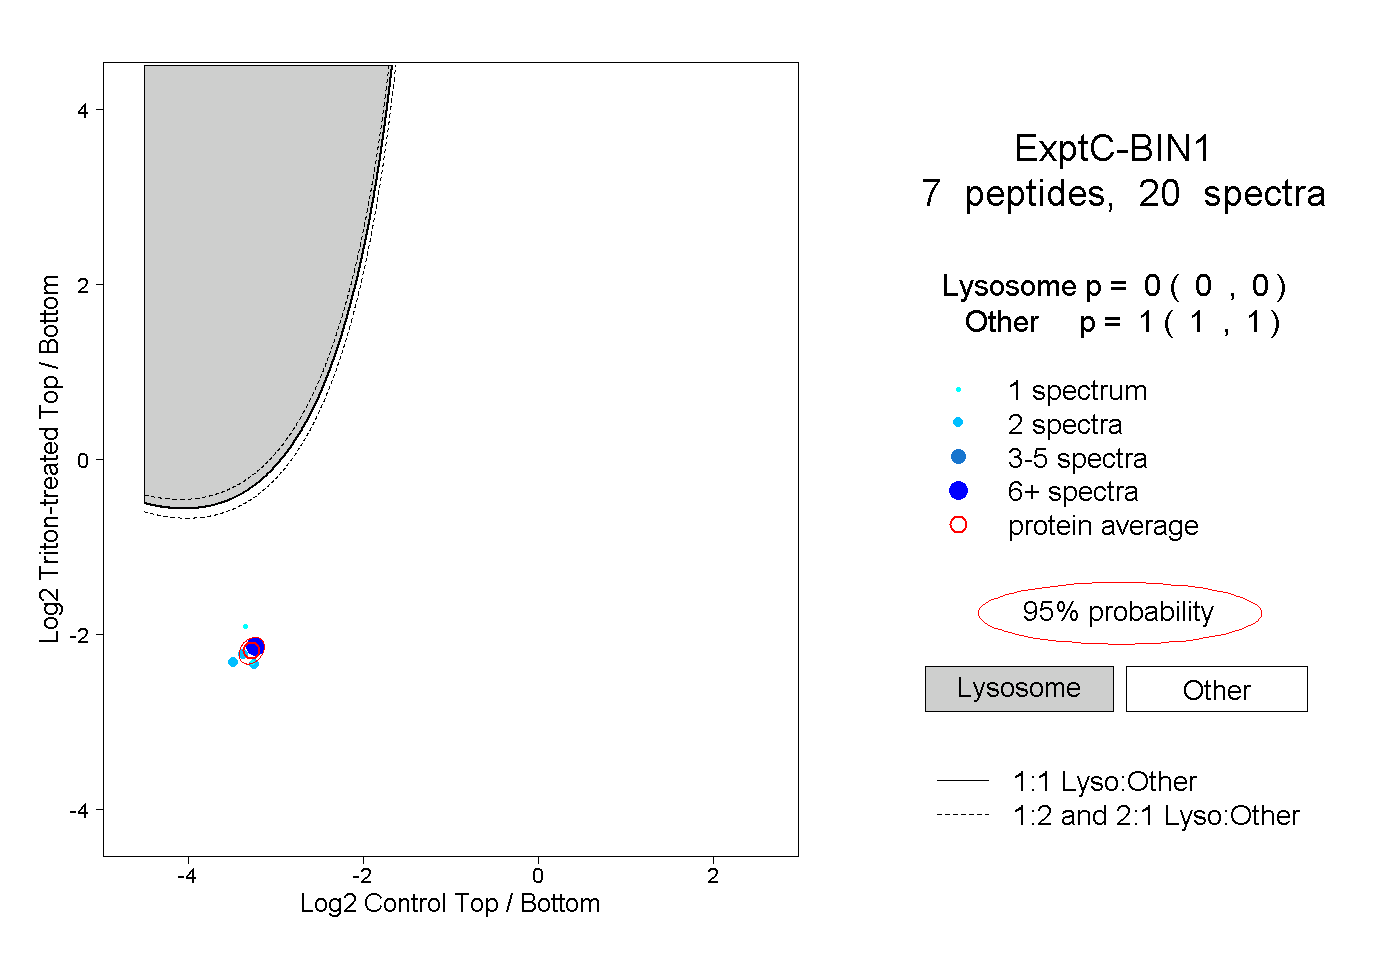 |
0.000 0.000 | 0.000 |
1.000 1.000 | 1.000 |