 25
25peptides
spectra
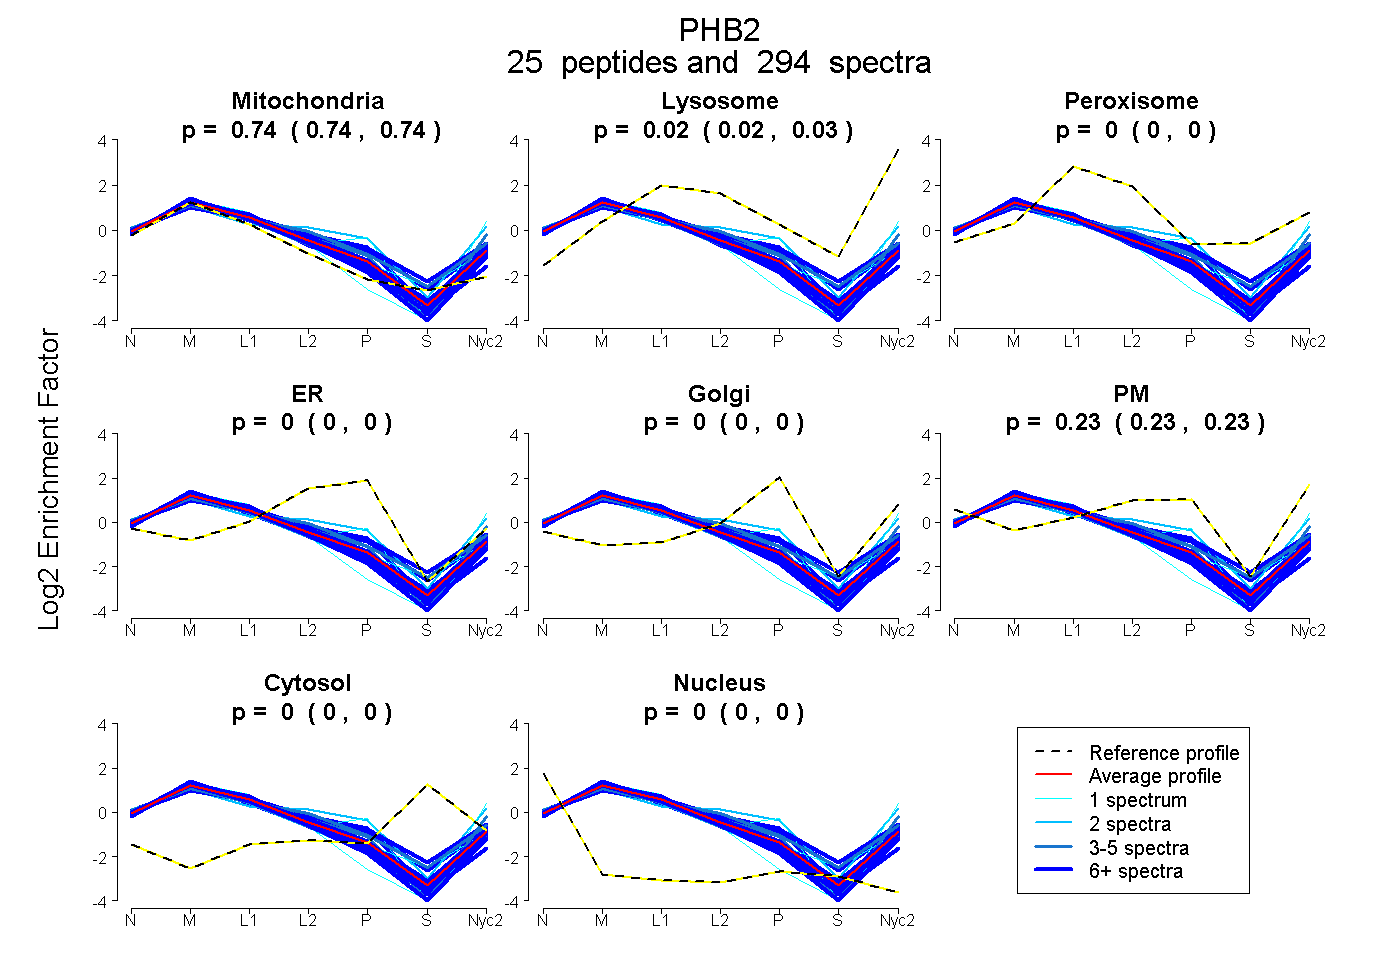
0.742 | 0.745
0.023 | 0.026
0.000 | 0.000
0.000 | 0.000
0.000 | 0.000
0.230 | 0.234
0.000 | 0.000
0.000 | 0.000
| Plot | Mito | Lyso | Perox | ER | Golgi | PM | Cytosol | Nucleus | |||||
| Expt A |
25 peptides |
294 spectra |
|
0.744 0.742 | 0.745 |
0.025 0.023 | 0.026 |
0.000 0.000 | 0.000 |
0.000 0.000 | 0.000 |
0.000 0.000 | 0.000 |
0.232 0.230 | 0.234 |
0.000 0.000 | 0.000 |
0.000 0.000 | 0.000 |
| 7 spectra, GMGTALK | 0.634 | 0.020 | 0.032 | 0.022 | 0.000 | 0.293 | 0.000 | 0.000 | ||
| 4 spectra, MLGEALSK | 0.626 | 0.038 | 0.059 | 0.000 | 0.000 | 0.277 | 0.000 | 0.000 | ||
| 20 spectra, LGLDYEER | 0.606 | 0.047 | 0.063 | 0.000 | 0.021 | 0.263 | 0.000 | 0.000 | ||
| 3 spectra, NPGYIK | 0.833 | 0.000 | 0.000 | 0.000 | 0.000 | 0.167 | 0.000 | 0.000 | ||
| 13 spectra, VLPSIVNEVLK | 0.747 | 0.030 | 0.000 | 0.000 | 0.000 | 0.223 | 0.000 | 0.000 | ||
| 9 spectra, QVAQQEAER | 0.763 | 0.000 | 0.000 | 0.028 | 0.000 | 0.208 | 0.000 | 0.000 | ||
| 2 spectra, IGGVQQDTILAEGLHFR | 0.468 | 0.036 | 0.000 | 0.000 | 0.000 | 0.496 | 0.000 | 0.000 | ||
| 7 spectra, ESVFTVEGGHR | 0.621 | 0.006 | 0.061 | 0.000 | 0.000 | 0.312 | 0.000 | 0.000 | ||
| 25 spectra, VLSRPNAQELPSMYQR | 0.815 | 0.050 | 0.000 | 0.000 | 0.000 | 0.135 | 0.000 | 0.000 | ||
| 1 spectrum, DFSLILDDVAITELSFSR | 0.911 | 0.070 | 0.000 | 0.000 | 0.000 | 0.019 | 0.000 | 0.000 | ||
| 21 spectra, DLQMVNISLR | 0.717 | 0.053 | 0.000 | 0.000 | 0.000 | 0.230 | 0.000 | 0.000 | ||
| 18 spectra, AQVSLLIR | 0.781 | 0.035 | 0.000 | 0.000 | 0.000 | 0.184 | 0.000 | 0.000 | ||
| 2 spectra, ISSPTGSK | 0.815 | 0.000 | 0.000 | 0.000 | 0.000 | 0.185 | 0.000 | 0.000 | ||
| 25 spectra, FNASQLITQR | 0.816 | 0.000 | 0.000 | 0.000 | 0.000 | 0.184 | 0.000 | 0.000 | ||
| 24 spectra, QVAQQEAQR | 0.815 | 0.004 | 0.000 | 0.000 | 0.000 | 0.181 | 0.000 | 0.000 | ||
| 7 spectra, IVQAEGEAEAAK | 0.871 | 0.000 | 0.000 | 0.049 | 0.000 | 0.080 | 0.000 | 0.000 | ||
| 25 spectra, LPSGPR | 0.806 | 0.004 | 0.000 | 0.000 | 0.000 | 0.189 | 0.000 | 0.000 | ||
| 1 spectrum, IPWFQYPIIYDIR | 0.491 | 0.000 | 0.000 | 0.000 | 0.000 | 0.509 | 0.000 | 0.000 | ||
| 6 spectra, AQFLVEK | 0.633 | 0.036 | 0.000 | 0.080 | 0.000 | 0.251 | 0.000 | 0.000 | ||
| 1 spectrum, IYLTADNLVLNLQDESFTR | 0.733 | 0.036 | 0.057 | 0.000 | 0.000 | 0.173 | 0.000 | 0.000 | ||
| 4 spectra, AAQNISK | 0.770 | 0.009 | 0.000 | 0.000 | 0.000 | 0.221 | 0.000 | 0.000 | ||
| 4 spectra, LLLGAGAVAYGVR | 0.638 | 0.039 | 0.000 | 0.000 | 0.000 | 0.323 | 0.000 | 0.000 | ||
| 32 spectra, TIATSQNR | 0.849 | 0.000 | 0.000 | 0.000 | 0.000 | 0.151 | 0.000 | 0.000 | ||
| 29 spectra, AIFFNR | 0.785 | 0.012 | 0.000 | 0.000 | 0.000 | 0.204 | 0.000 | 0.000 | ||
| 4 spectra, EYTAAVEAK | 0.785 | 0.058 | 0.000 | 0.000 | 0.000 | 0.157 | 0.000 | 0.000 |
| Plot | Mito | Lyso or Perox | ER | Golgi | PM | Cytosol | Nucleus | ||||||
| Expt B |
21 peptides |
179 spectra |
 |
0.944 0.941 | 0.946 |
0.000 0.000 | 0.000 |
0.056 0.053 | 0.058 |
0.000 0.000 | 0.000 |
0.000 0.000 | 0.000 |
0.000 0.000 | 0.000 |
0.000 0.000 | 0.000 |
|||
| Plot | Lyso | Other | |||||||||||
| Expt C |
25 peptides |
1219 spectra |
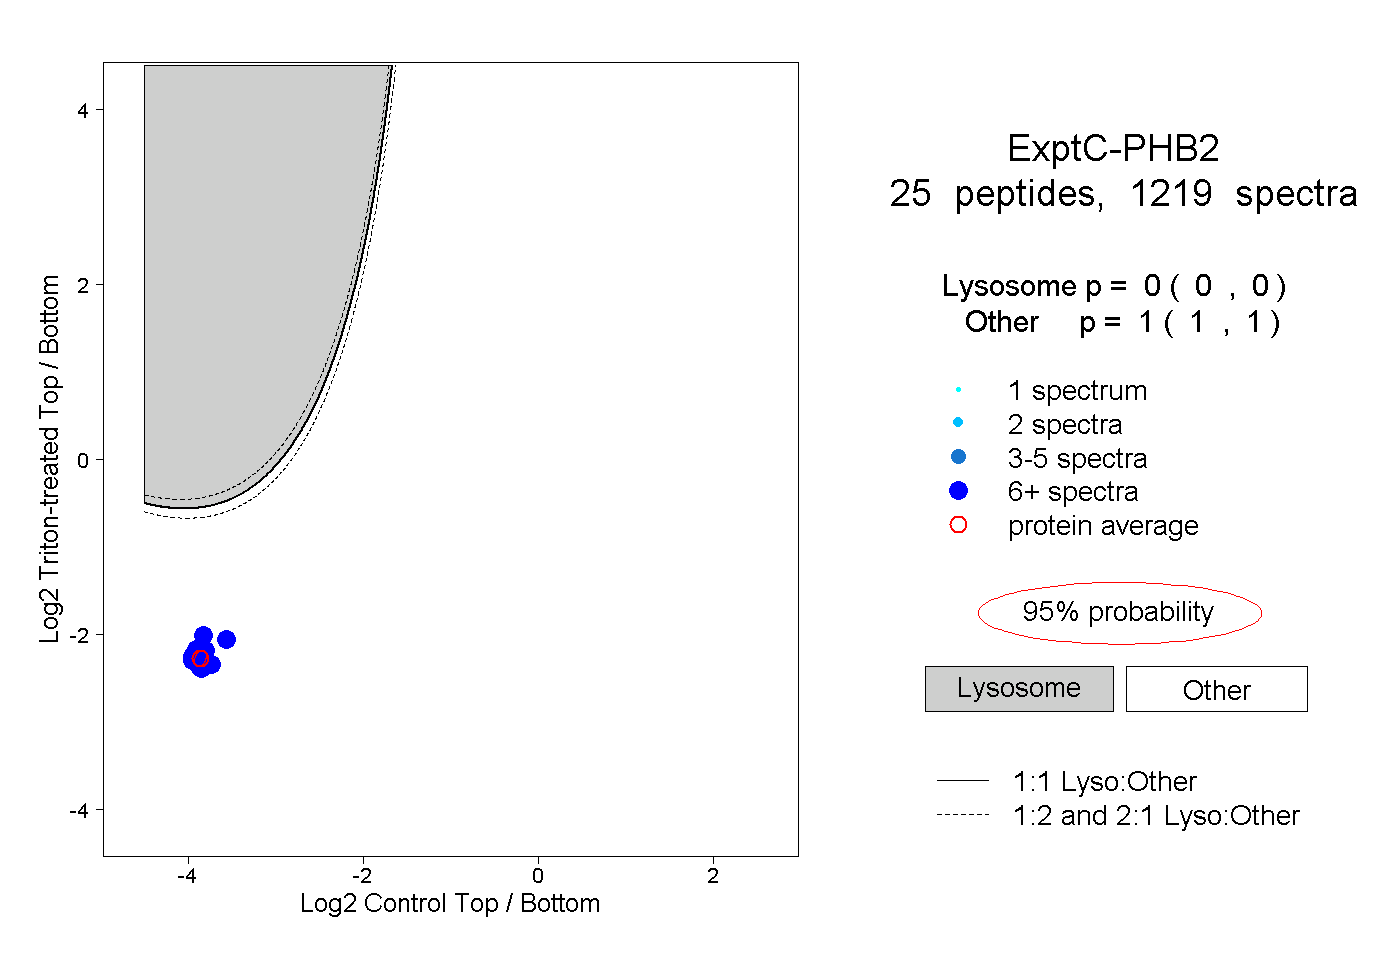 |
0.000 0.000 | 0.000 |
1.000 1.000 | 1.000 |
||||||||
| Plot | Lyso | Other | |||||||||||
| Expt D |
20 peptides |
78 spectra |
 |
0.000 0.000 | 0.000 |
1.000 1.000 | 1.000 |