 25
25peptides
spectra
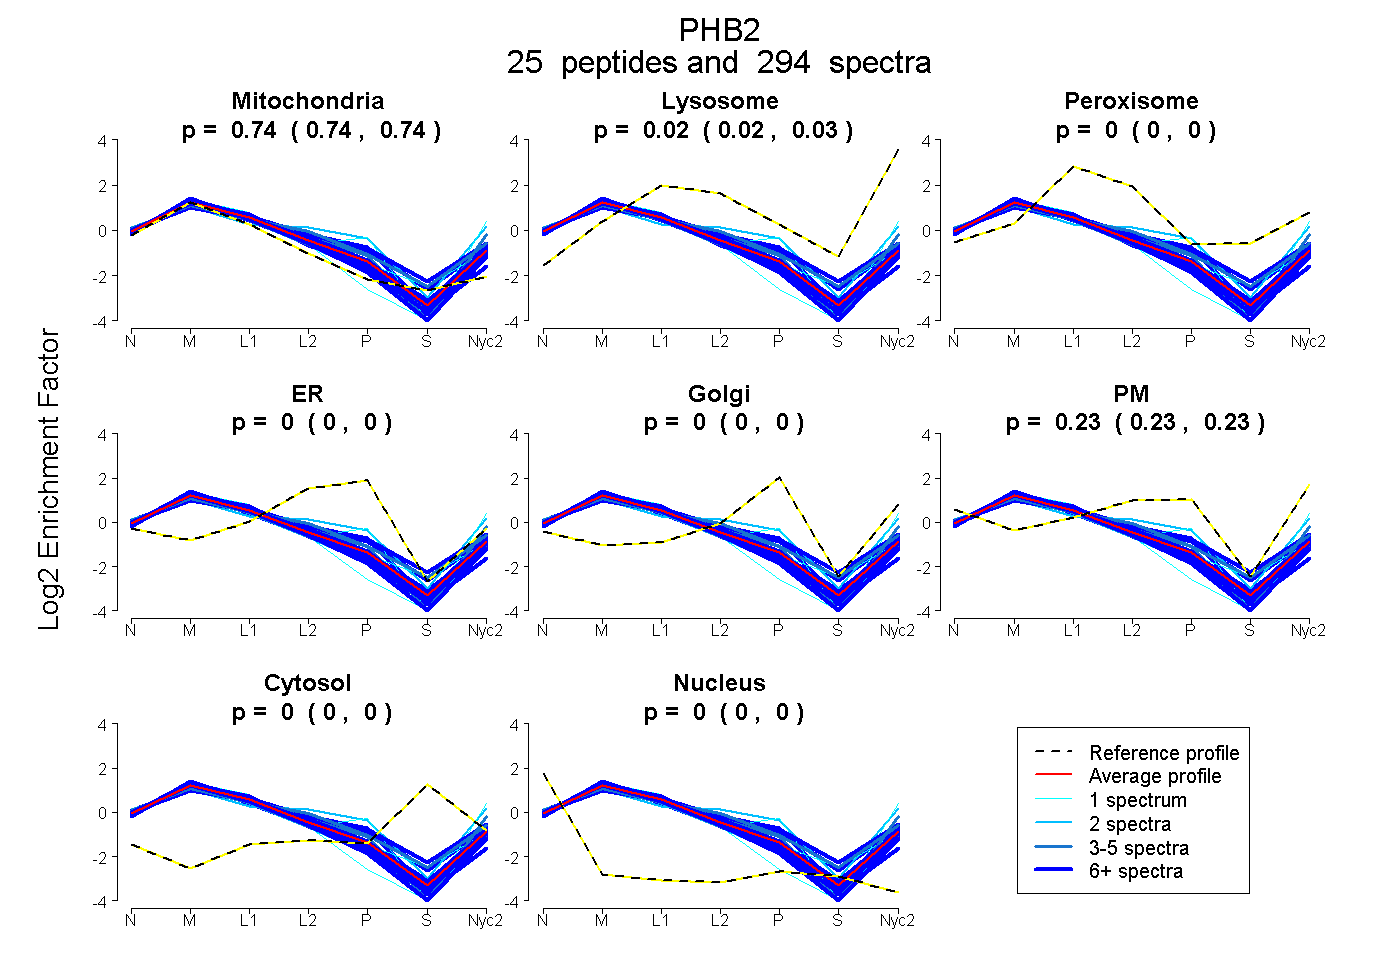
0.742 | 0.745
0.023 | 0.026
0.000 | 0.000
0.000 | 0.000
0.000 | 0.000
0.230 | 0.234
0.000 | 0.000
0.000 | 0.000
21peptides
spectra

0.941 | 0.946
0.000 | 0.000
0.053 | 0.058
0.000 | 0.000
0.000 | 0.000
0.000 | 0.000
0.000 | 0.000
25peptides
spectra
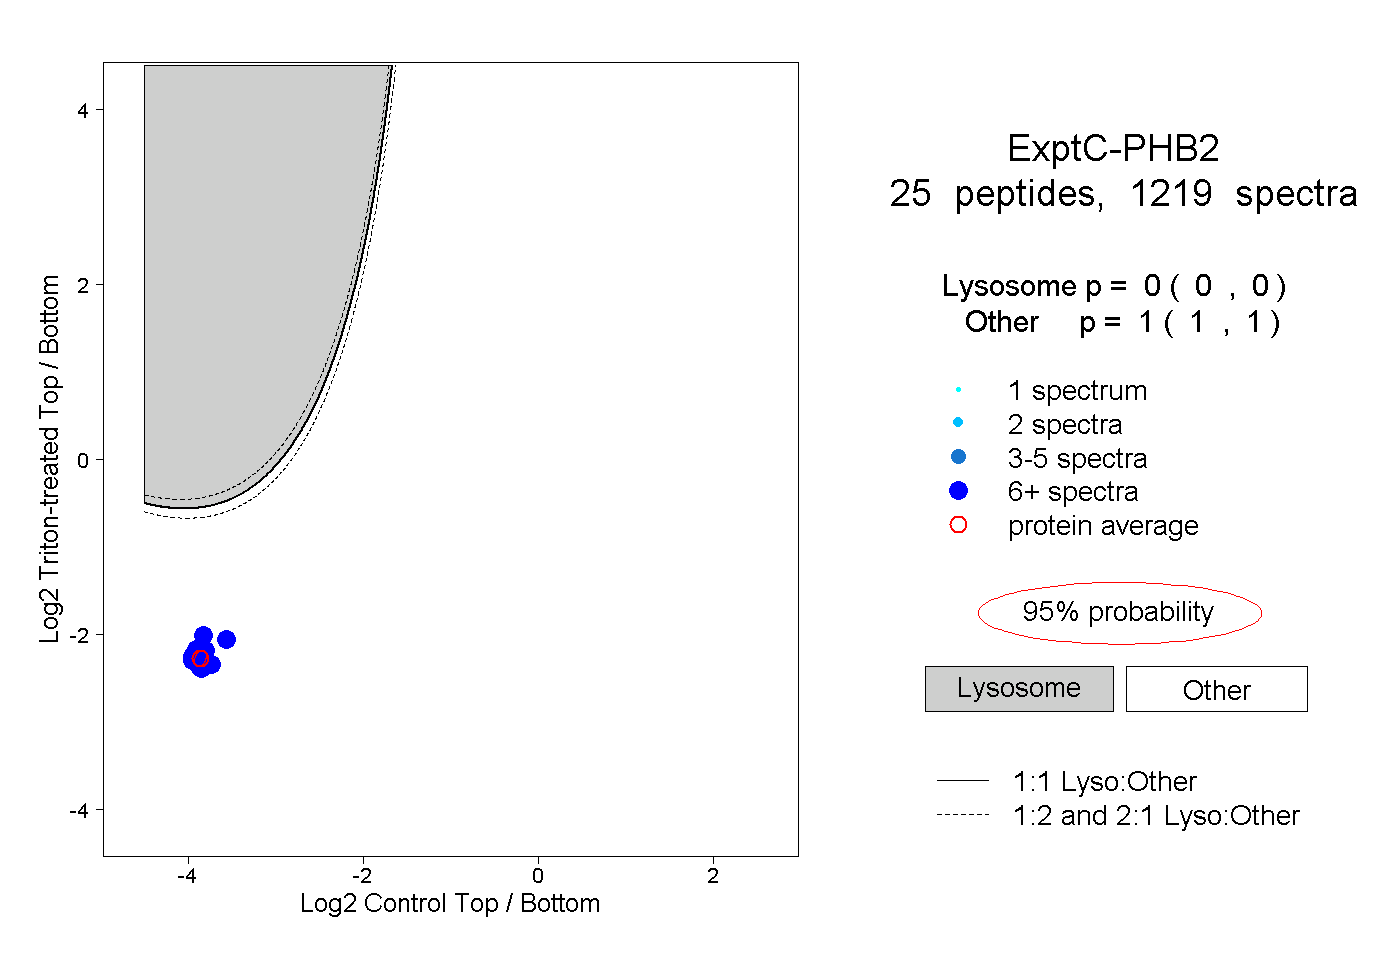
0.000 | 0.000
1.000 | 1.000
20peptides
spectra

0.000 | 0.000
1.000 | 1.000