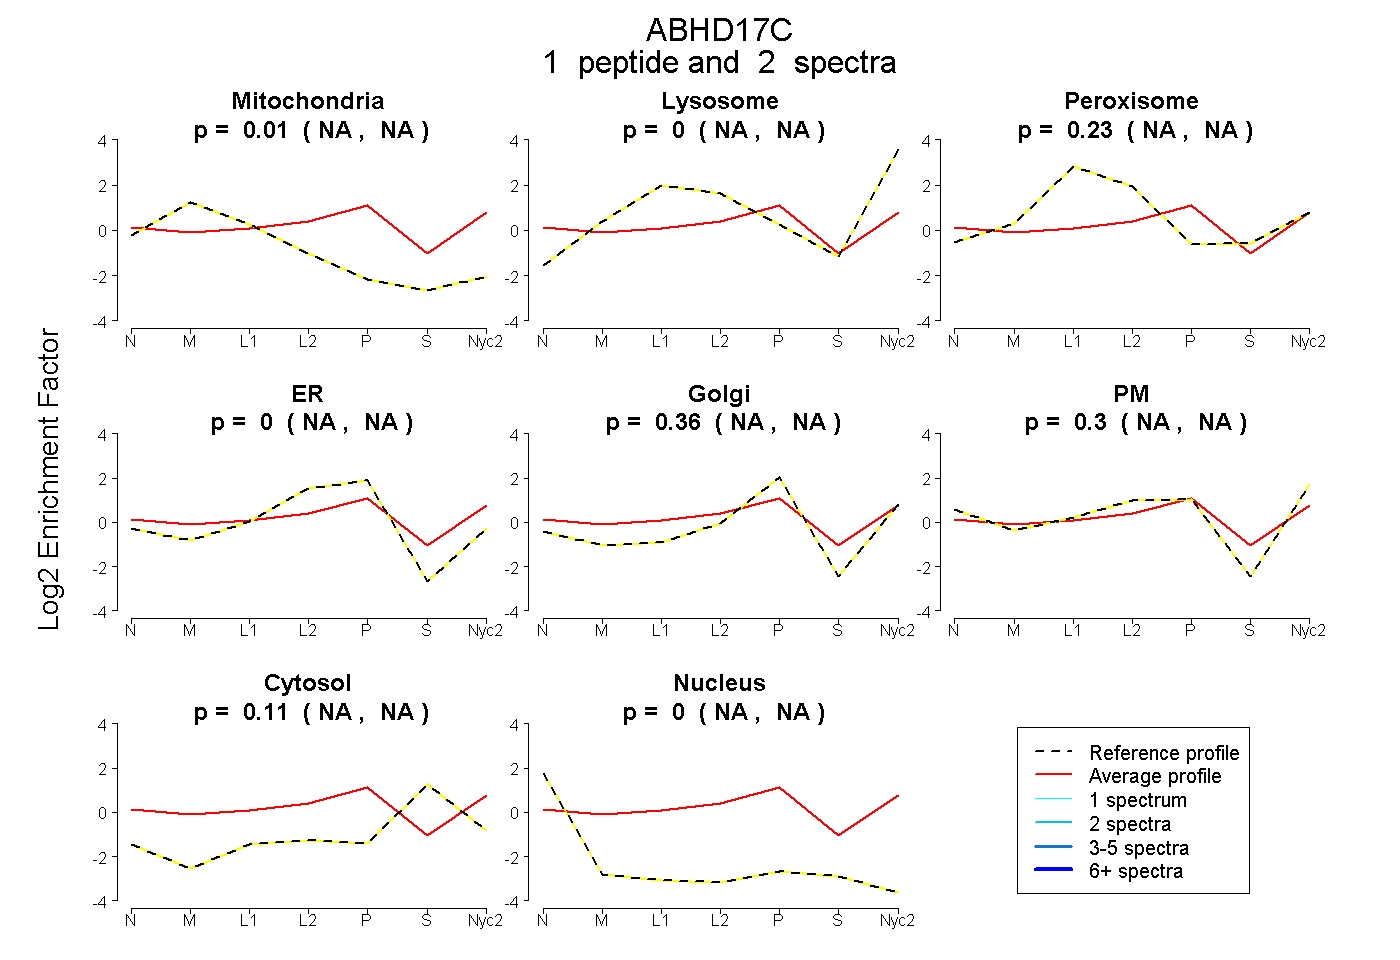
 1
1peptide
spectra
NA | NA
NA | NA
NA | NA
NA | NA
NA | NA
NA | NA
NA | NA
NA | NA
| Plot | Mito | Lyso | Perox | ER | Golgi | PM | Cytosol | Nucleus | |||||
| Expt A |
1 peptide |
2 spectra |
|
0.006 NA | NA |
0.000 NA | NA |
0.228 NA | NA |
0.000 NA | NA |
0.356 NA | NA |
0.299 NA | NA |
0.111 NA | NA |
0.000 NA | NA |
| 2 spectra, LGCMFVR | 0.006 | 0.000 | 0.228 | 0.000 | 0.356 | 0.299 | 0.111 | 0.000 |
| Plot | Lyso | Other | |||||||||||
| Expt C |
1 peptide |
2 spectra |
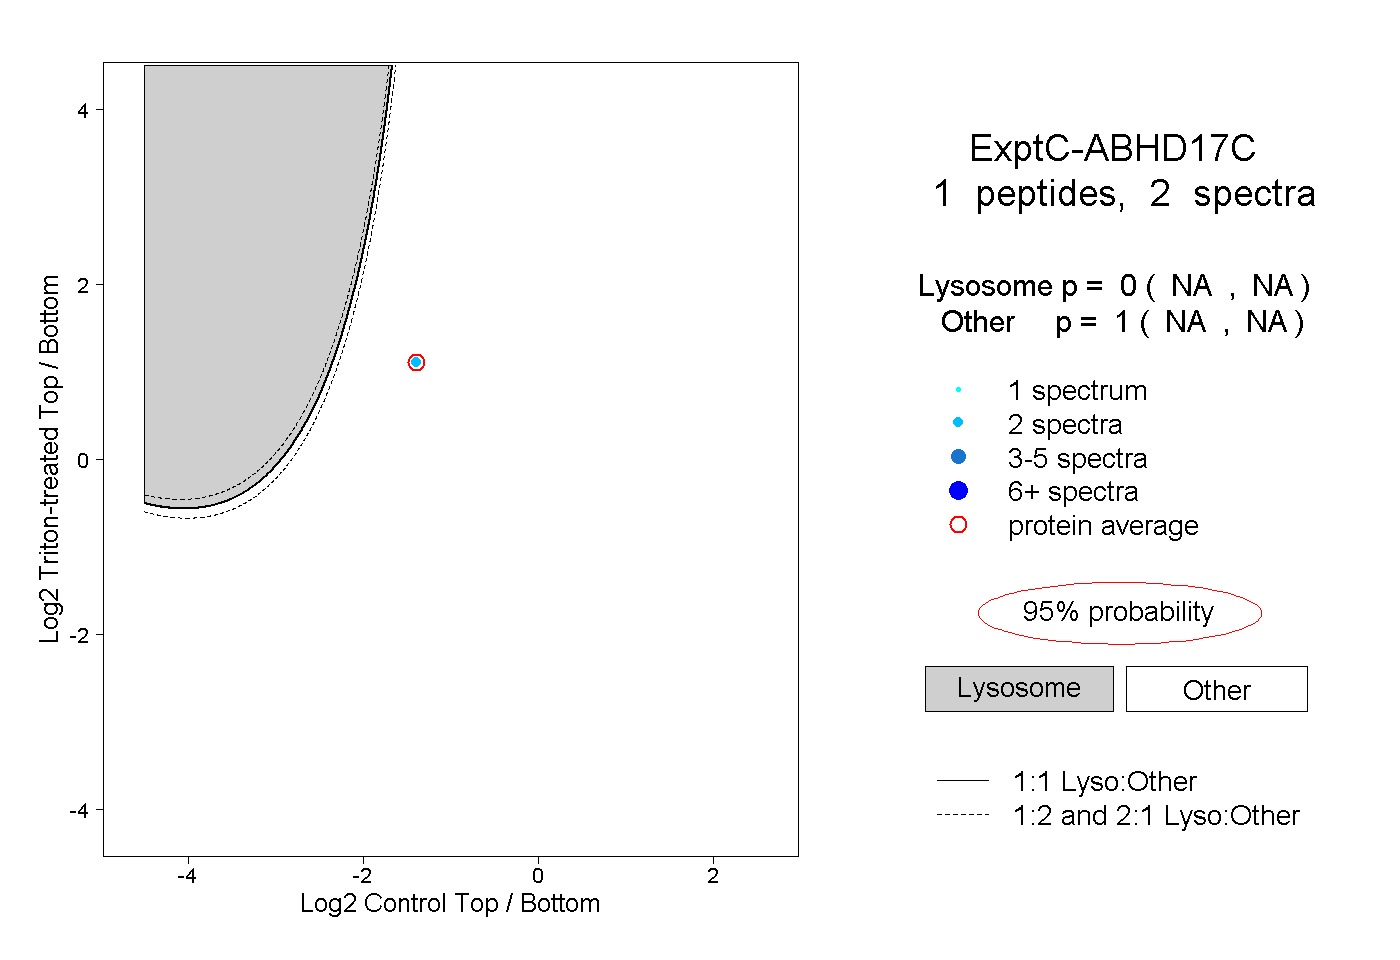 |
0.000 NA | NA |
1.000 NA | NA |