 1
1peptide
spectra

0.000 | 0.000
0.000 | 0.000
0.000 | 0.000
0.462 | 0.499
0.178 | 0.237
0.000 | 0.000
0.280 | 0.331
0.000 | 0.000
2peptides
spectra
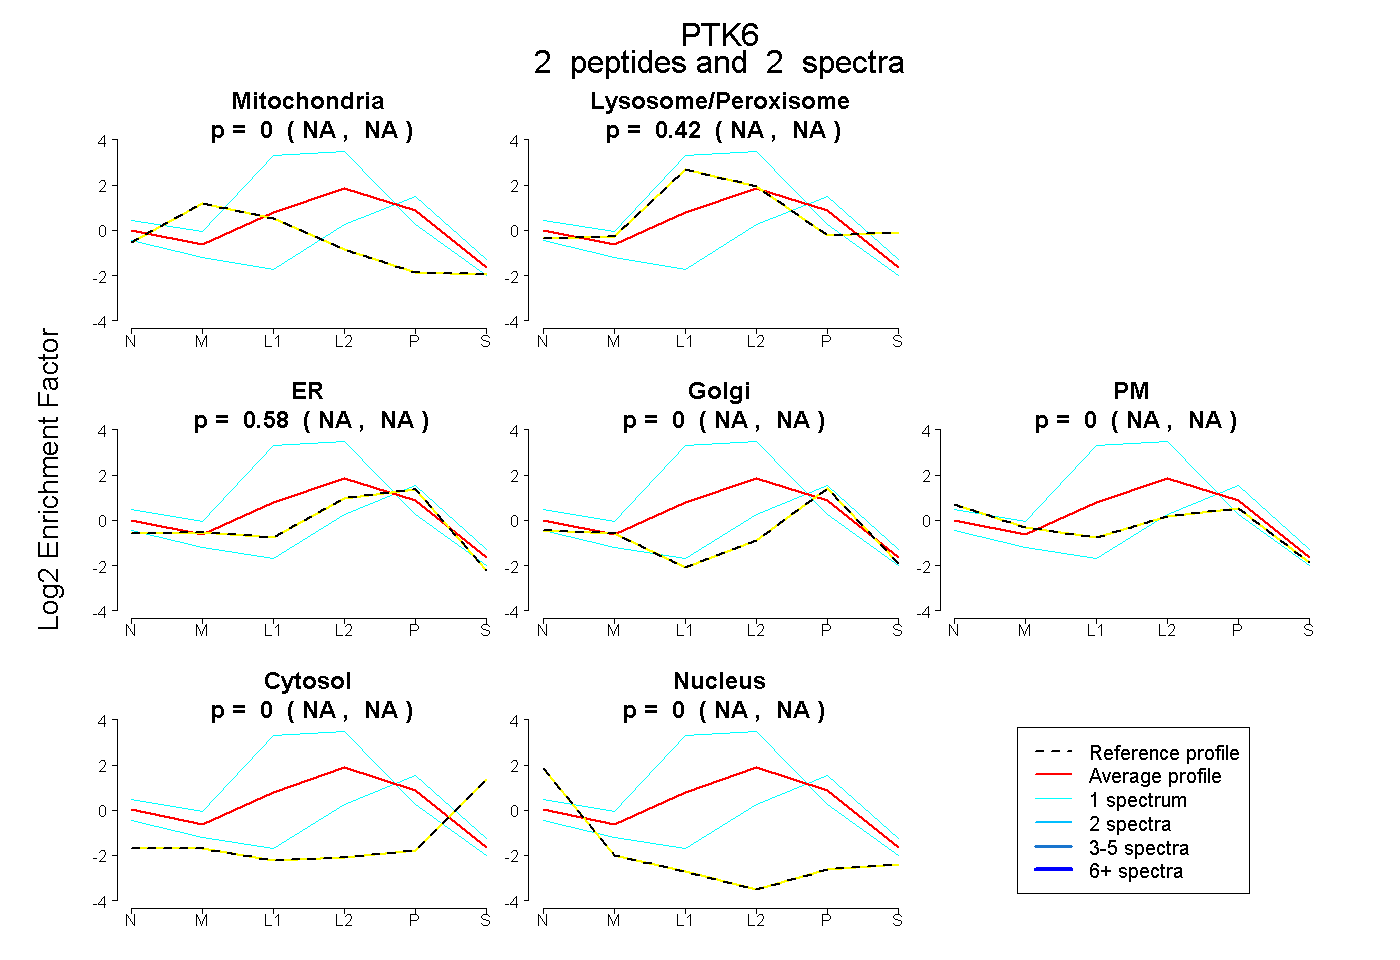
NA | NA
NA | NA
NA | NA
NA | NA
NA | NA
NA | NA
NA | NA
3peptides
spectra
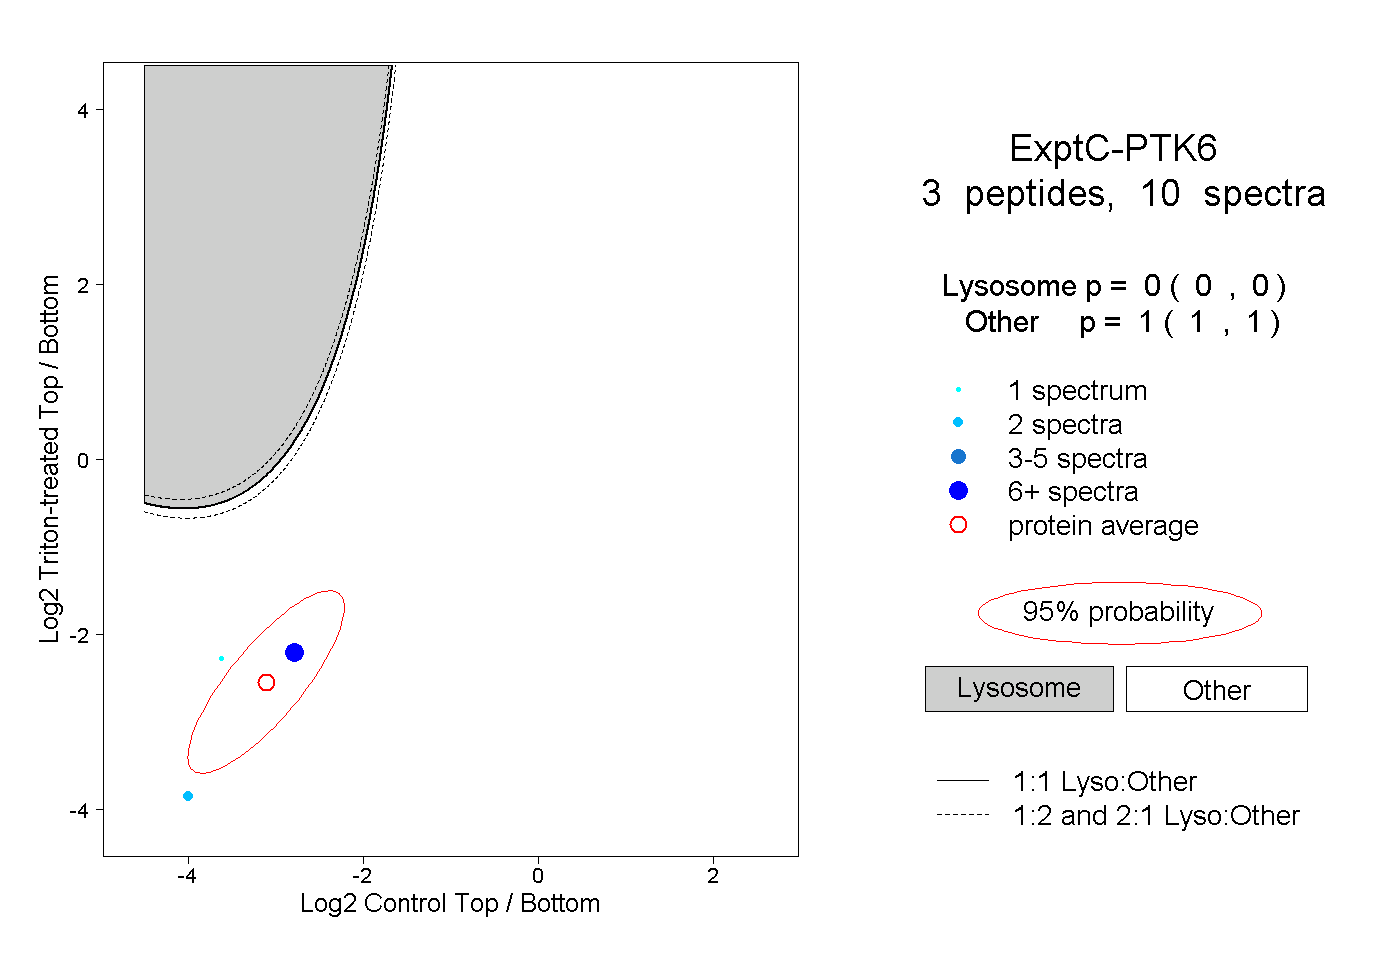
0.000 | 0.000
1.000 | 1.000