EEFSEC
[ENSRNOP00000017323]
Main page
| | | Plot |
Mito |
Lyso |
|
Perox |
ER |
Golgi |
PM |
Cytosol |
Nucleus |
|
| Expt A |
 15
15
peptides |
35
spectra |
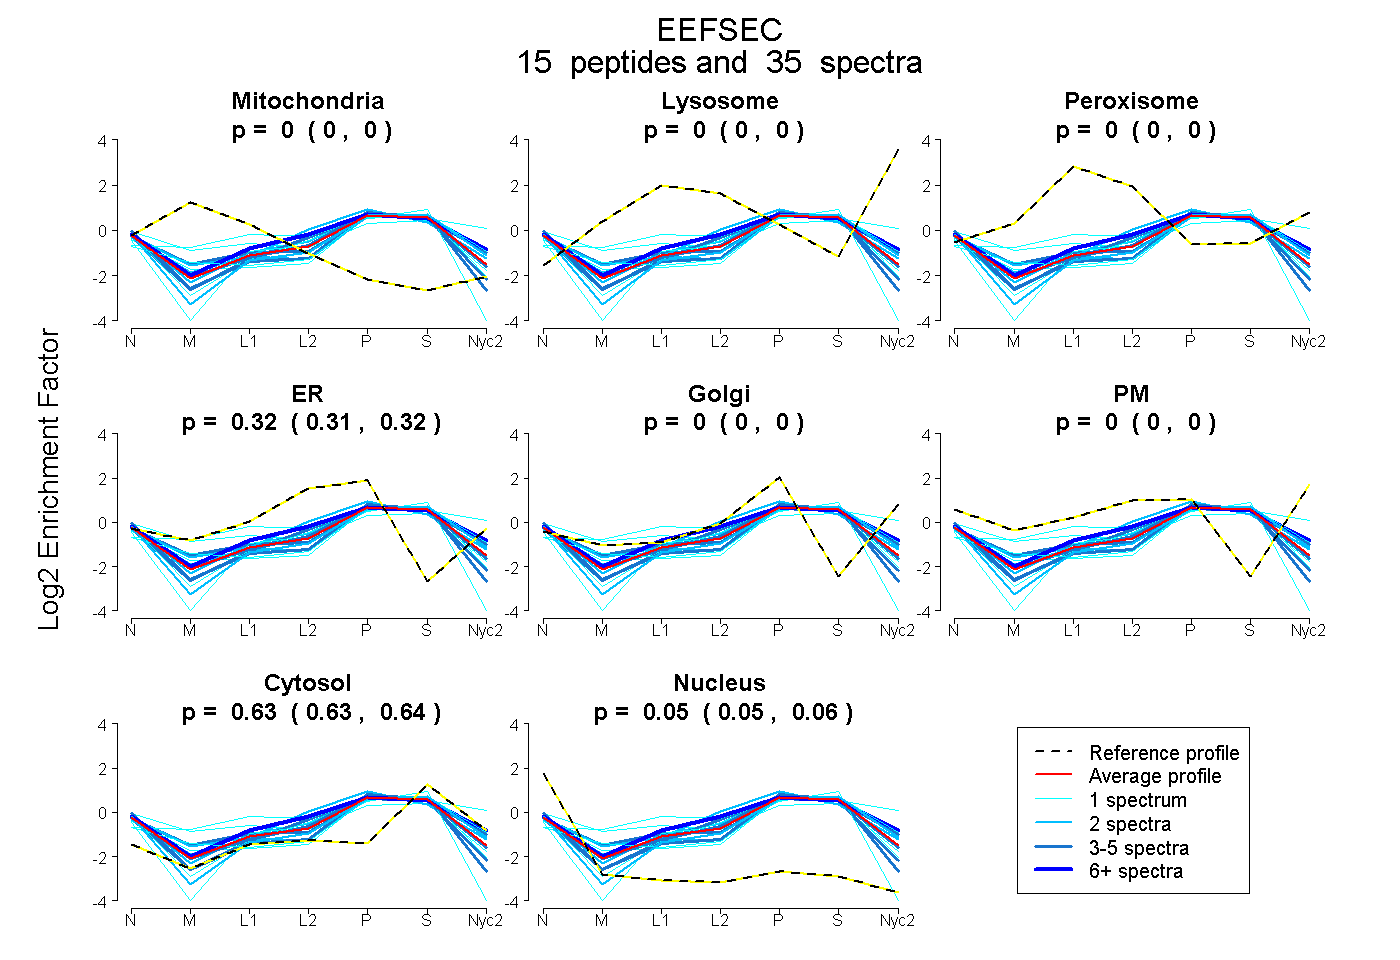 |
0.000
0.000 | 0.000 |
0.000
0.000 | 0.000 |
|
0.000
0.000 | 0.000 |
0.316
0.309 | 0.320 |
0.000
0.000 | 0.003 |
0.000
0.000 | 0.000 |
0.632
0.628 | 0.635 |
0.052
0.047 | 0.057 |
|
| | | Plot |
Mito |
|
Lyso or Perox |
|
ER |
Golgi |
PM |
Cytosol |
Nucleus |
|
| Expt B |
6
peptides |
6
spectra |
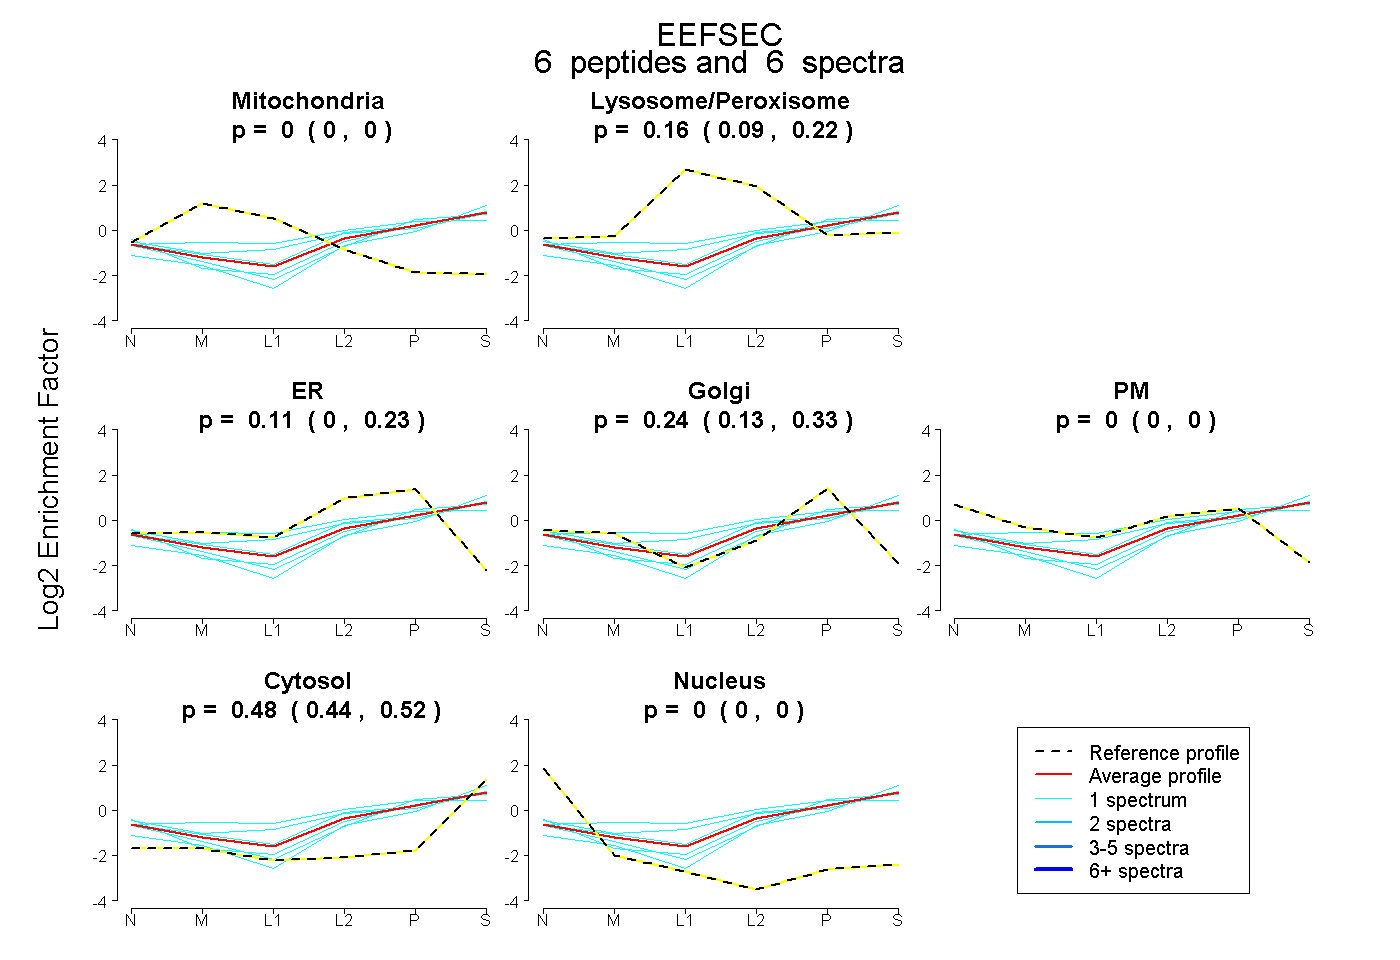 |
0.000
0.000 | 0.000 |
|
0.160
0.087 | 0.221 |
|
0.114
0.000 | 0.226 |
0.243
0.126 | 0.325 |
0.000
0.000 | 0.005 |
0.483
0.444 | 0.516 |
0.000
0.000 | 0.000 |
|
| 1 spectrum, EYLFQEQYLCK |
0.000 |
|
0.043 |
|
0.165 |
0.133 |
0.115 |
0.545 |
0.000 |
|
| 1 spectrum, LDADIHTNTCR |
0.000 |
|
0.165 |
|
0.210 |
0.144 |
0.000 |
0.481 |
0.000 |
|
| 1 spectrum, ILTPTLK |
0.000 |
|
0.368 |
|
0.000 |
0.339 |
0.000 |
0.293 |
0.000 |
|
| 1 spectrum, SQISIPTR |
0.000 |
|
0.051 |
|
0.086 |
0.366 |
0.000 |
0.498 |
0.000 |
|
| 1 spectrum, LCLVIGSR |
0.000 |
|
0.325 |
|
0.000 |
0.241 |
0.021 |
0.414 |
0.000 |
|
| 1 spectrum, VMDDYSVIGR |
0.000 |
|
0.000 |
|
0.203 |
0.127 |
0.000 |
0.670 |
0.000 |
|
| | | Plot |
|
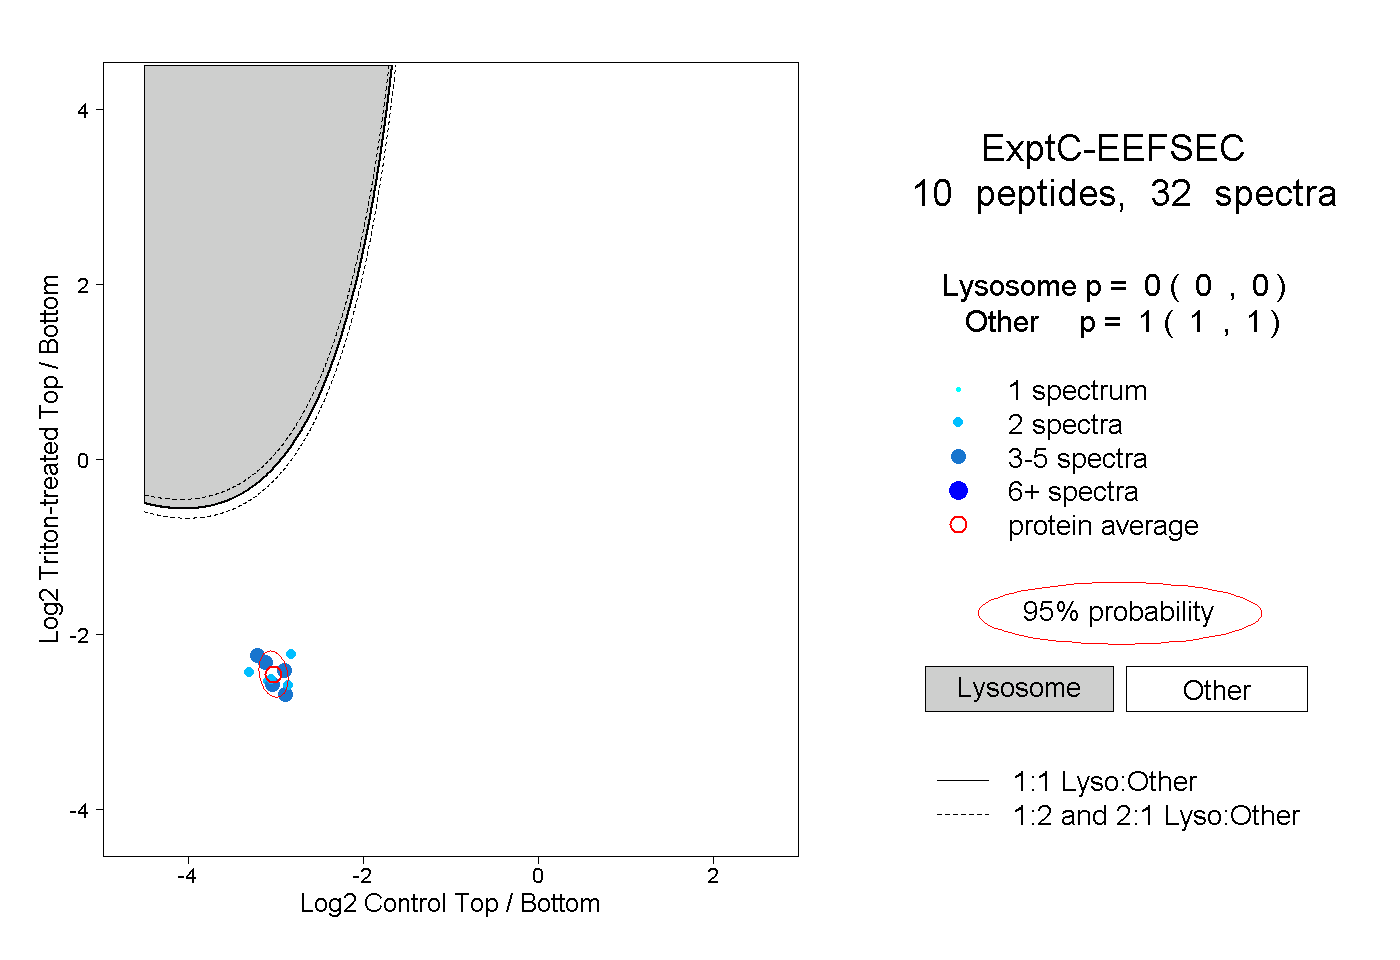
Lyso |
|
|
|
|
|
|
|
Other |
| Expt C |
10
peptides |
32
spectra |
 |
|
0.000
0.000 | 0.000 |
|
|
|
|
|
|
|
1.000
1.000 | 1.000 |