 14
14peptides
spectra
0.000 | 0.000
0.000 | 0.000
0.000 | 0.000
0.000 | 0.000
0.000 | 0.000
0.000 | 0.000
0.987 | 0.991
0.009 | 0.013
| Plot | Mito | Lyso | Perox | ER | Golgi | PM | Cytosol | Nucleus | |||||
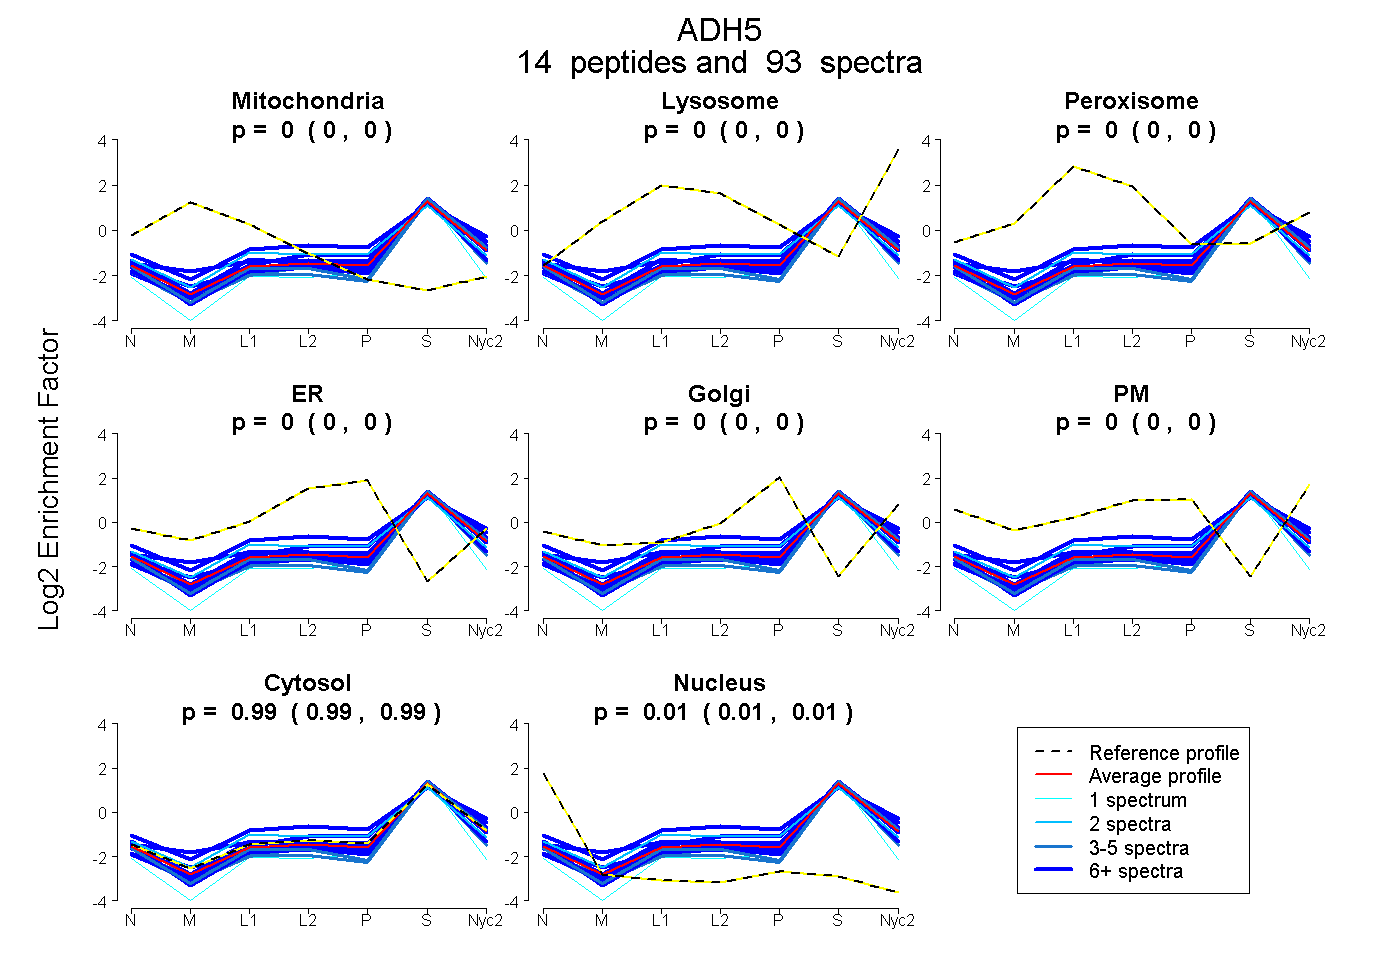
| Expt A |
14 peptides |
93 spectra |
|
0.000 0.000 | 0.000 |
0.000 0.000 | 0.000 |
0.000 0.000 | 0.000 |
0.000 0.000 | 0.000 |
0.000 0.000 | 0.000 |
0.000 0.000 | 0.000 |
0.989 0.987 | 0.991 |
0.011 0.009 | 0.013 |
| 8 spectra, VAGASR | 0.000 | 0.000 | 0.000 | 0.000 | 0.000 | 0.000 | 0.975 | 0.025 | ||
| 6 spectra, IIGIDINK | 0.000 | 0.000 | 0.000 | 0.000 | 0.000 | 0.000 | 1.000 | 0.000 | ||
| 5 spectra, FCLNPK | 0.000 | 0.000 | 0.000 | 0.000 | 0.000 | 0.000 | 0.953 | 0.047 | ||
| 7 spectra, TNLCQK | 0.000 | 0.000 | 0.000 | 0.000 | 0.000 | 0.000 | 0.949 | 0.051 | ||
| 7 spectra, LVSEYMSK | 0.043 | 0.054 | 0.000 | 0.000 | 0.000 | 0.000 | 0.903 | 0.000 | ||
| 7 spectra, GTAFGGWK | 0.000 | 0.000 | 0.000 | 0.000 | 0.000 | 0.000 | 1.000 | 0.000 | ||
| 3 spectra, IDPSAPLDK | 0.000 | 0.000 | 0.000 | 0.000 | 0.000 | 0.000 | 0.965 | 0.035 | ||
| 3 spectra, VDEFVTGNLSFDQINK | 0.000 | 0.000 | 0.000 | 0.000 | 0.000 | 0.000 | 0.978 | 0.022 | ||
| 9 spectra, SALEAAHK | 0.000 | 0.000 | 0.000 | 0.001 | 0.032 | 0.000 | 0.967 | 0.000 | ||
| 6 spectra, AFDLMHSGNSIR | 0.000 | 0.050 | 0.073 | 0.000 | 0.003 | 0.062 | 0.813 | 0.000 | ||
| 19 spectra, GLMPDGTSR | 0.000 | 0.000 | 0.000 | 0.000 | 0.000 | 0.000 | 0.997 | 0.003 | ||
| 2 spectra, VCLLGCGISTGYGAAVNTAK | 0.000 | 0.000 | 0.038 | 0.039 | 0.000 | 0.000 | 0.915 | 0.008 | ||
| 1 spectrum, AGDTVIPLYIPQCGECK | 0.000 | 0.000 | 0.000 | 0.000 | 0.000 | 0.000 | 0.903 | 0.097 | ||
| 10 spectra, SVESVPK | 0.000 | 0.000 | 0.000 | 0.000 | 0.000 | 0.000 | 0.969 | 0.031 |
| Plot | Mito | Lyso or Perox | ER | Golgi | PM | Cytosol | Nucleus | ||||||
| Expt B |
8 peptides |
12 spectra |
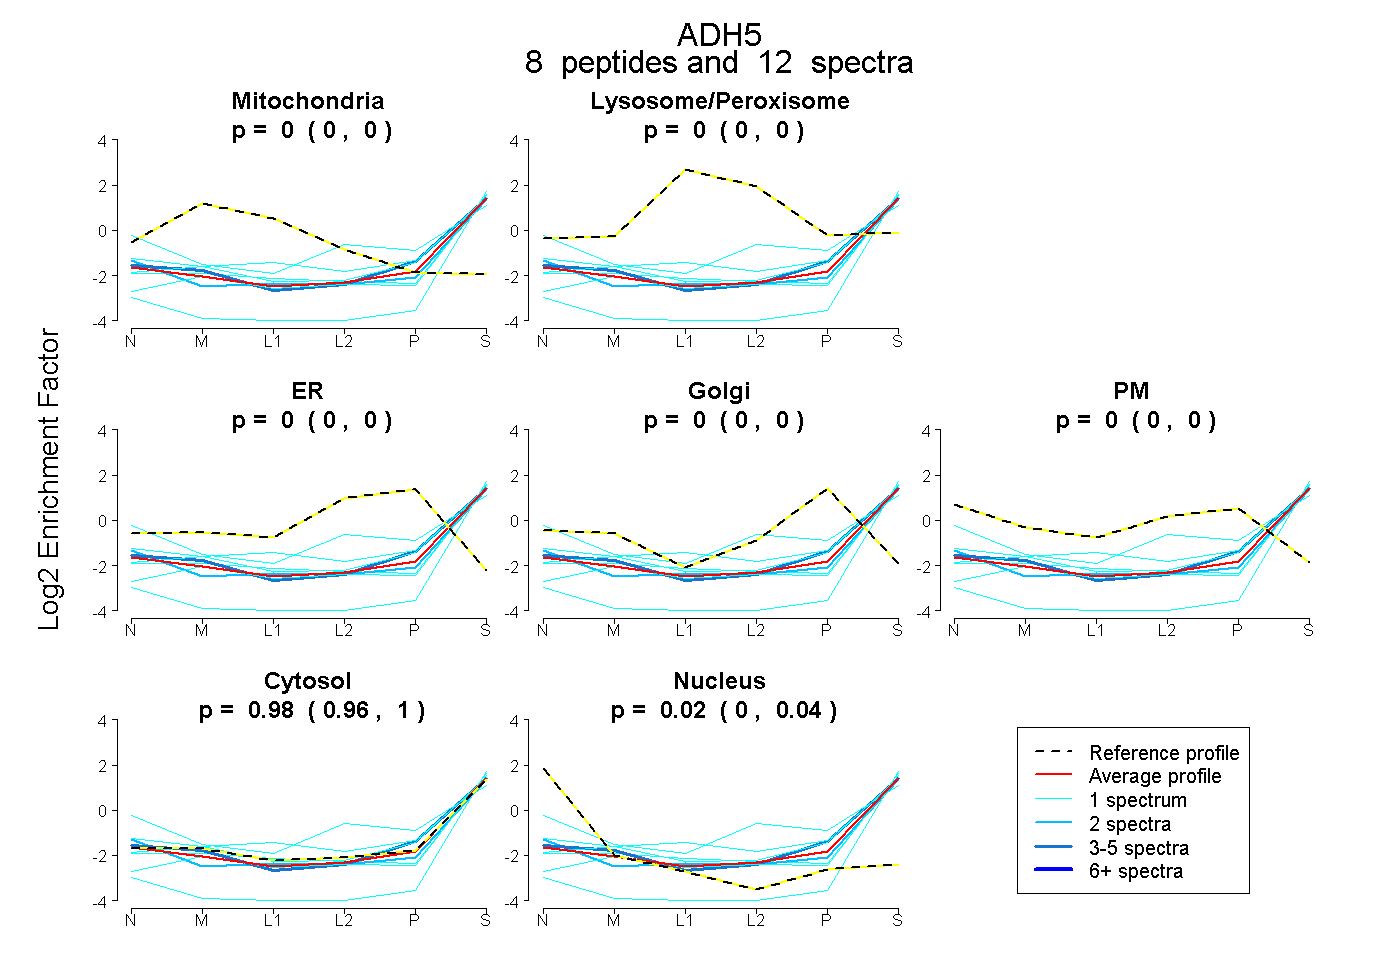 |
0.000 0.000 | 0.000 |
0.000 0.000 | 0.000 |
0.000 0.000 | 0.000 |
0.000 0.000 | 0.000 |
0.000 0.000 | 0.000 |
0.980 0.960 | 0.996 |
0.020 0.000 | 0.036 |
|||
| Plot | Lyso | Other | |||||||||||
| Expt C |
12 peptides |
110 spectra |
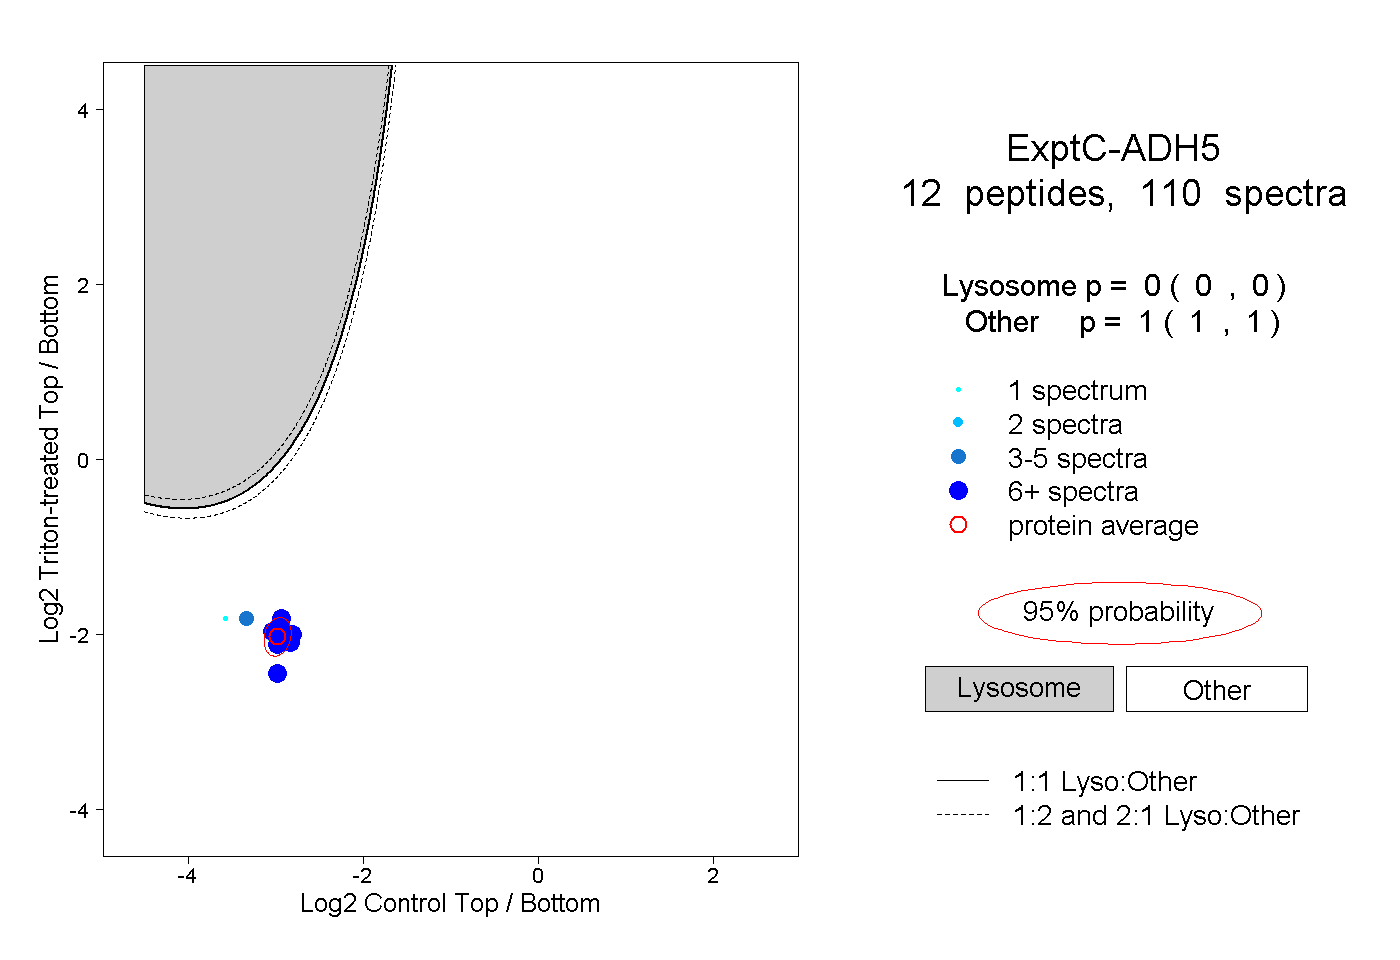 |
0.000 0.000 | 0.000 |
1.000 1.000 | 1.000 |
||||||||
| Plot | Lyso | Other | |||||||||||
| Expt D |
3 peptides |
6 spectra |
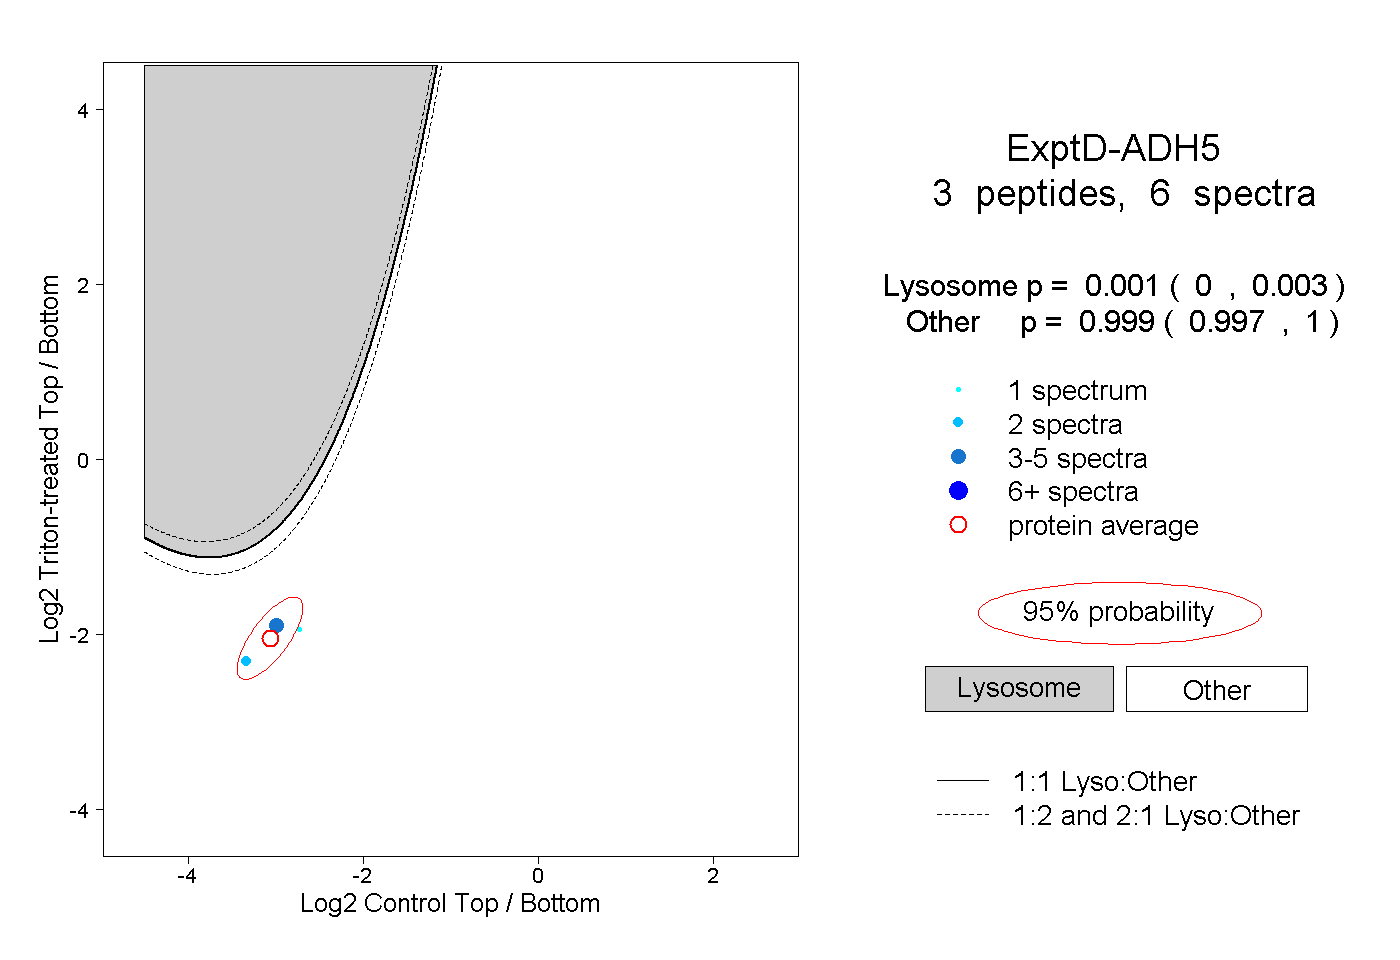 |
0.001 0.000 | 0.003 |
0.999 0.997 | 1.000 |