 5
5peptides
spectra
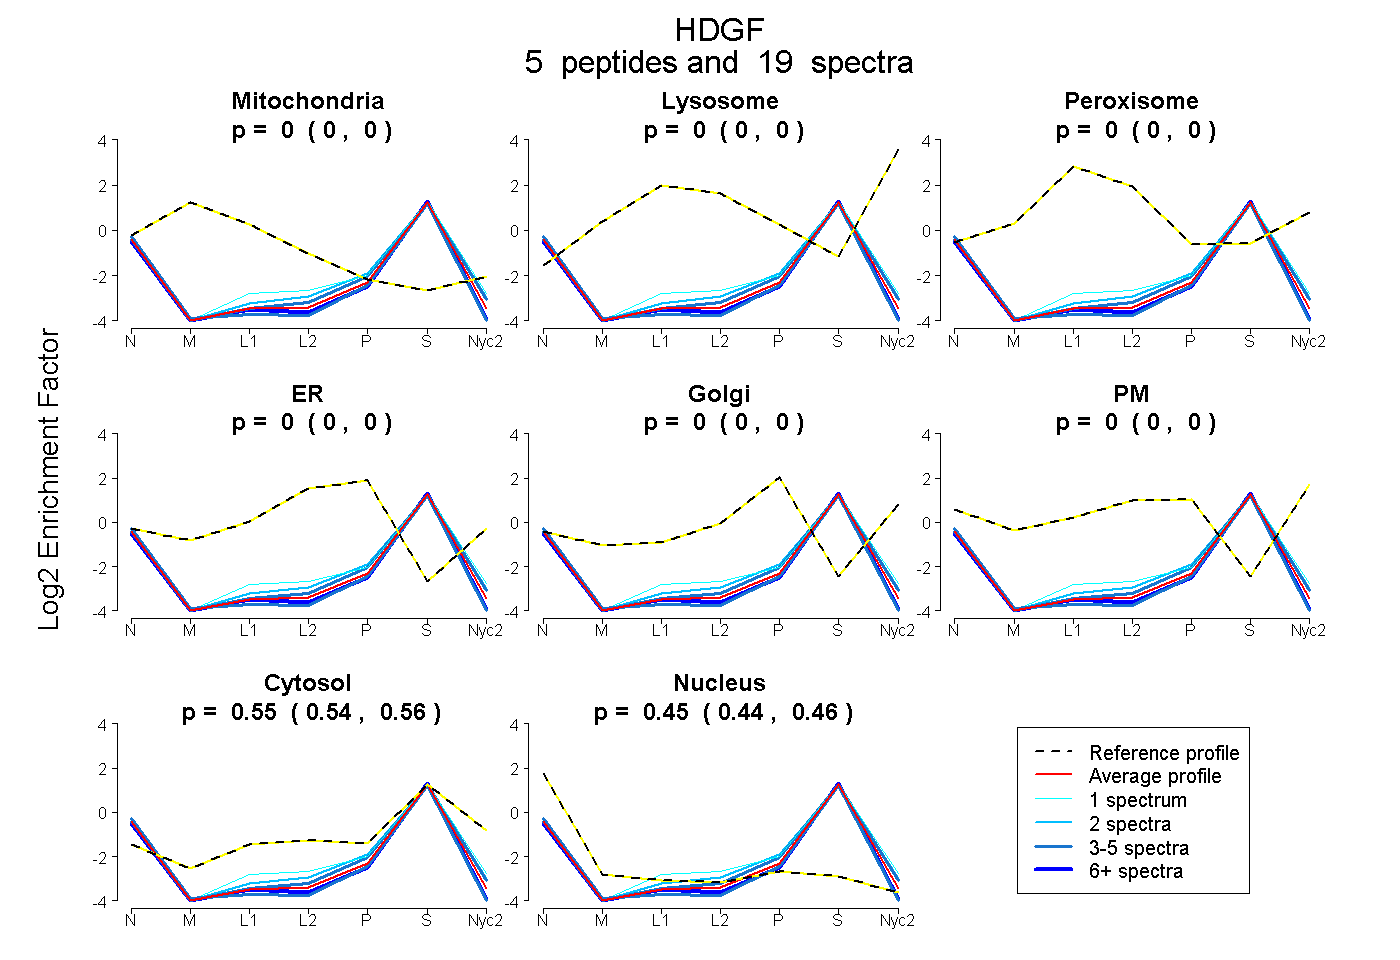
0.000 | 0.000
0.000 | 0.000
0.000 | 0.000
0.000 | 0.000
0.000 | 0.000
0.000 | 0.000
0.540 | 0.556
0.442 | 0.459
2peptides
spectra
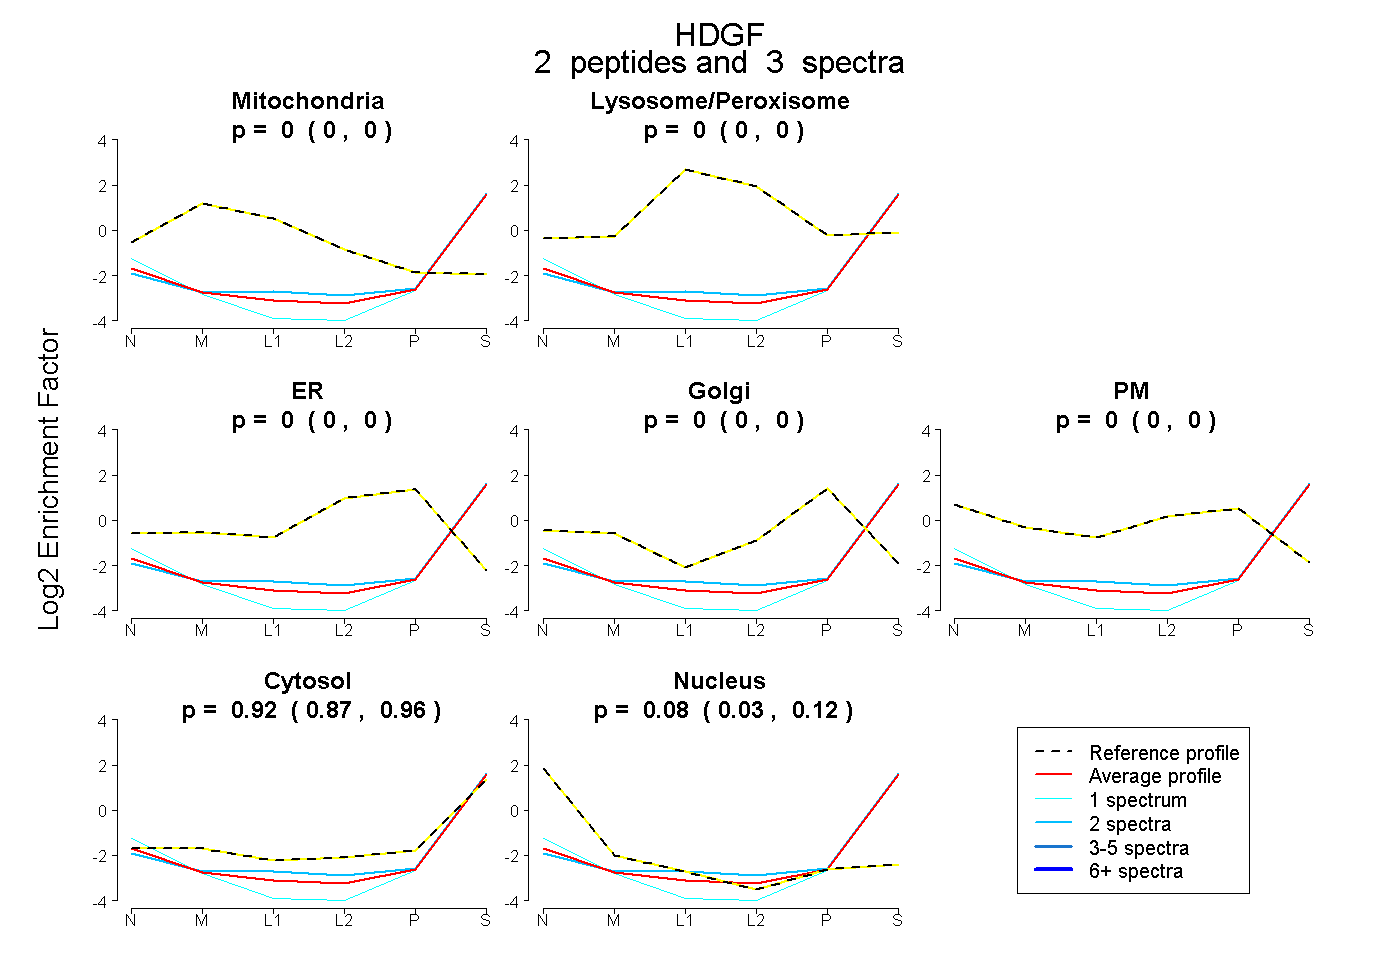
0.000 | 0.000
0.000 | 0.000
0.000 | 0.000
0.000 | 0.000
0.000 | 0.000
0.874 | 0.960
0.032 | 0.117
4peptides
spectra
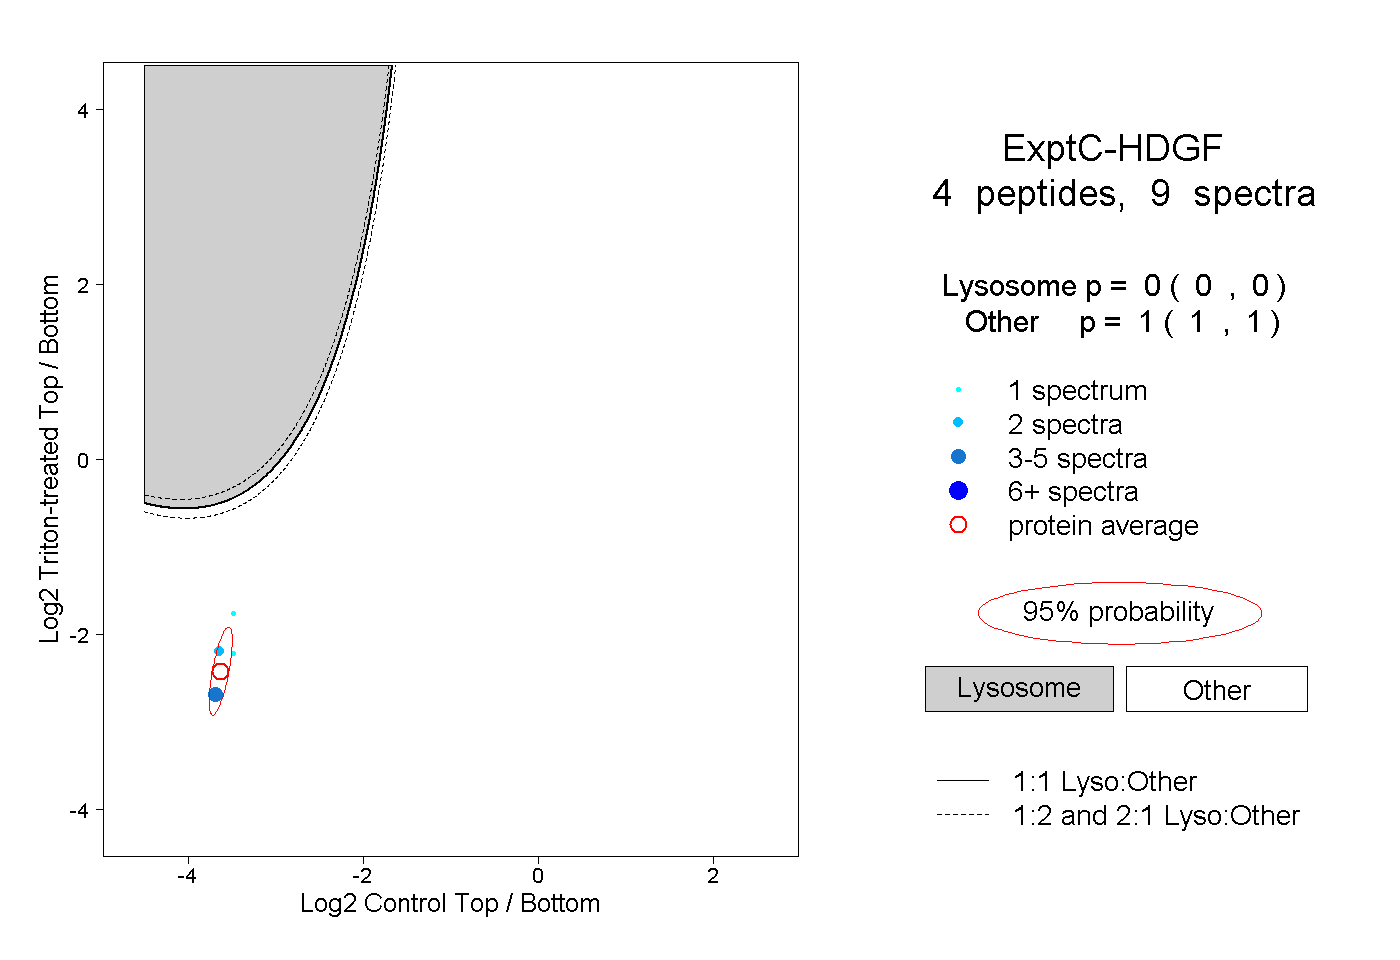
0.000 | 0.000
1.000 | 1.000