7
7peptides
spectra
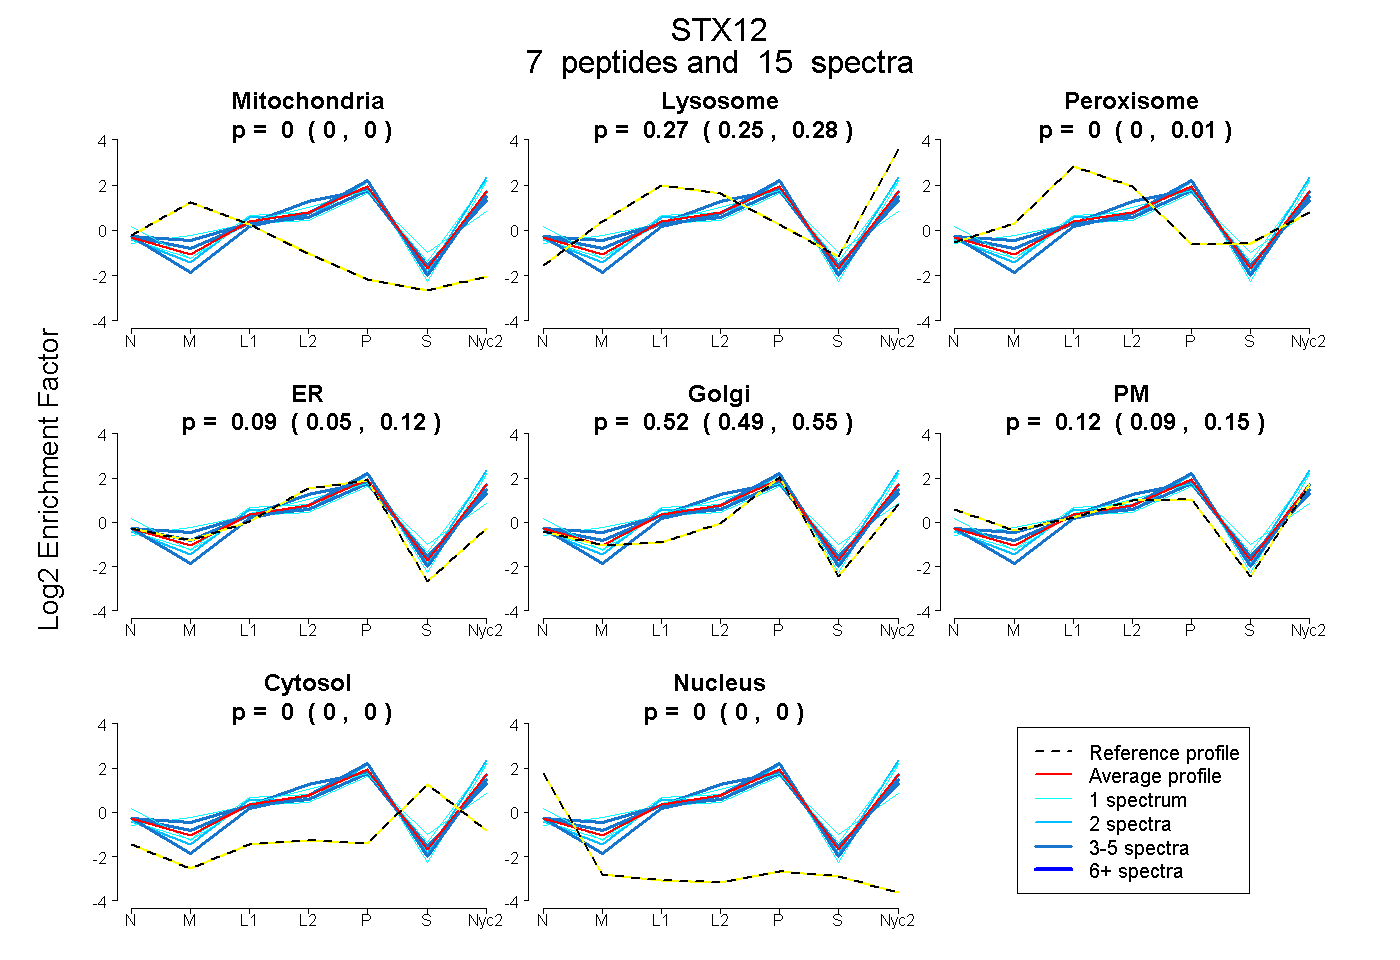
0.000 | 0.000
0.249 | 0.280
0.000 | 0.014
0.051 | 0.123
0.488 | 0.546
0.092 | 0.146
0.000 | 0.000
0.000 | 0.000
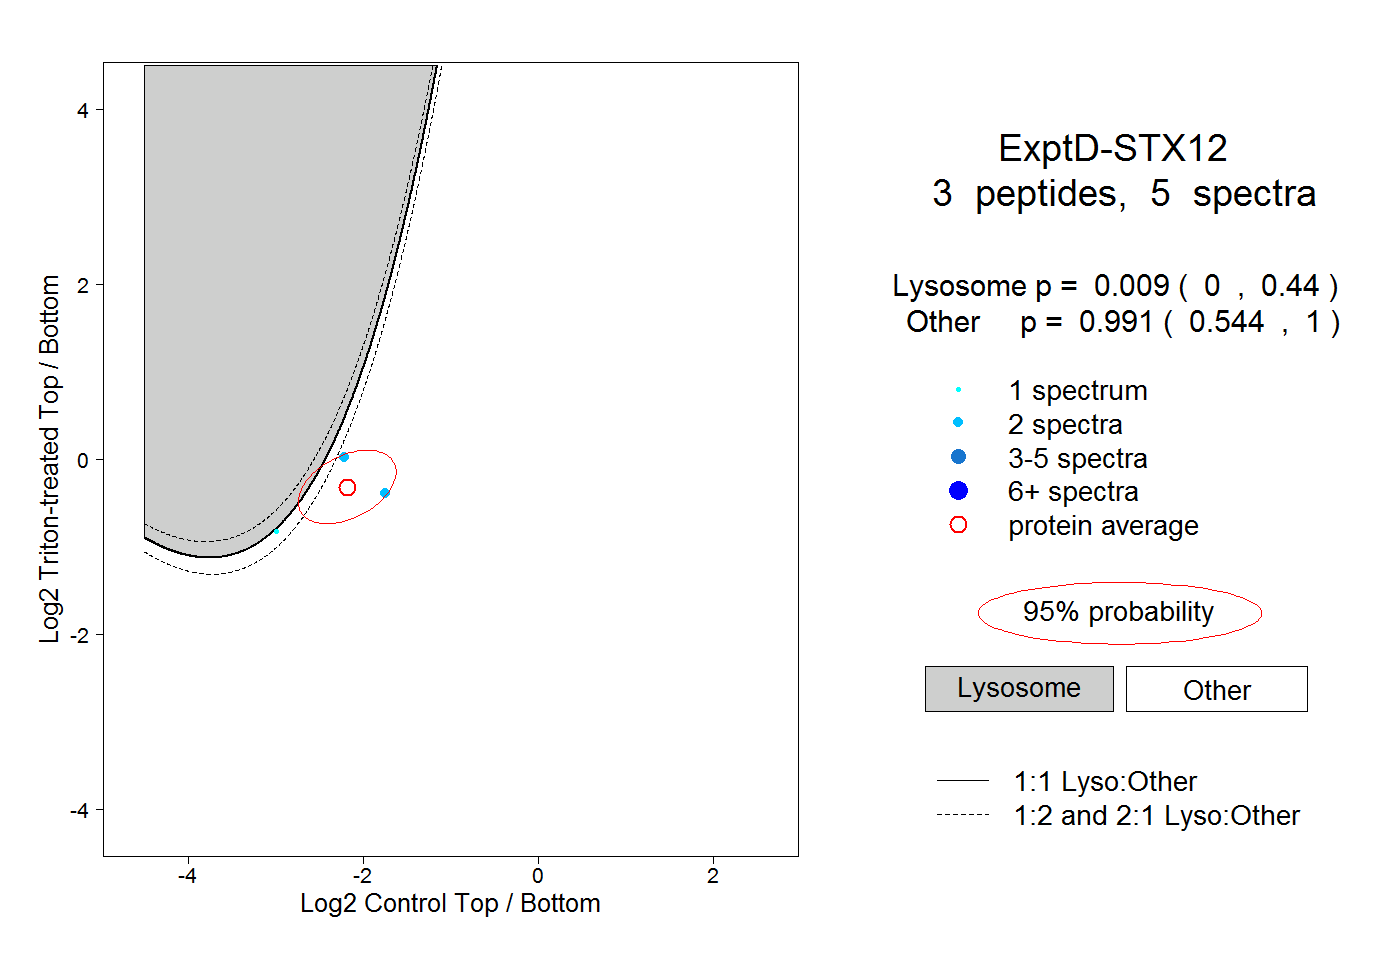
3peptides
spectra
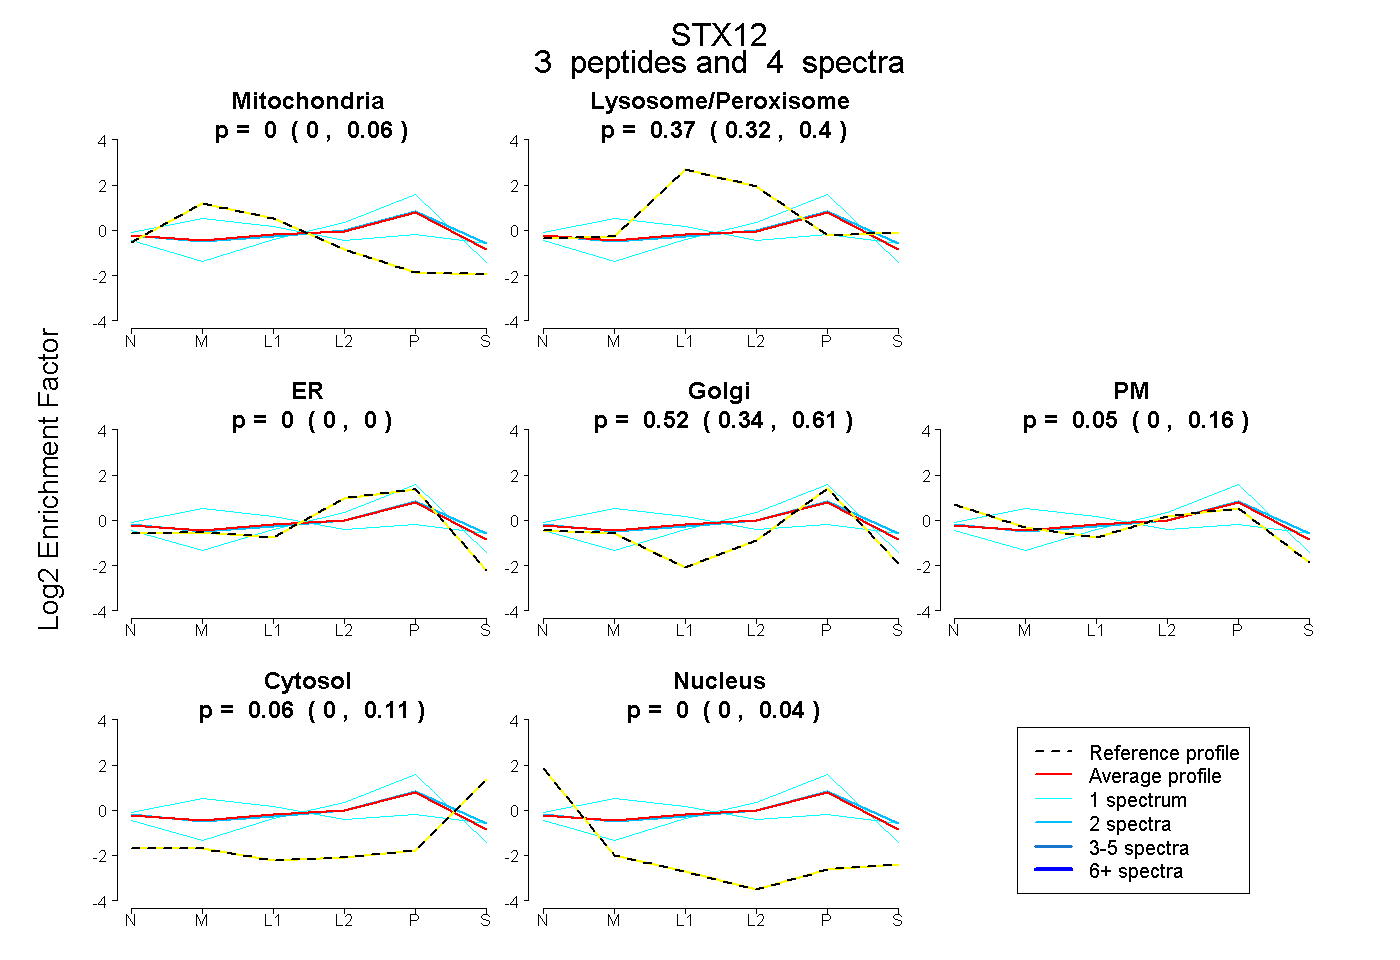
0.000 | 0.056
0.315 | 0.402
0.000 | 0.000
0.335 | 0.614
0.000 | 0.165
0.000 | 0.113
0.000 | 0.036