 7
7peptides
spectra
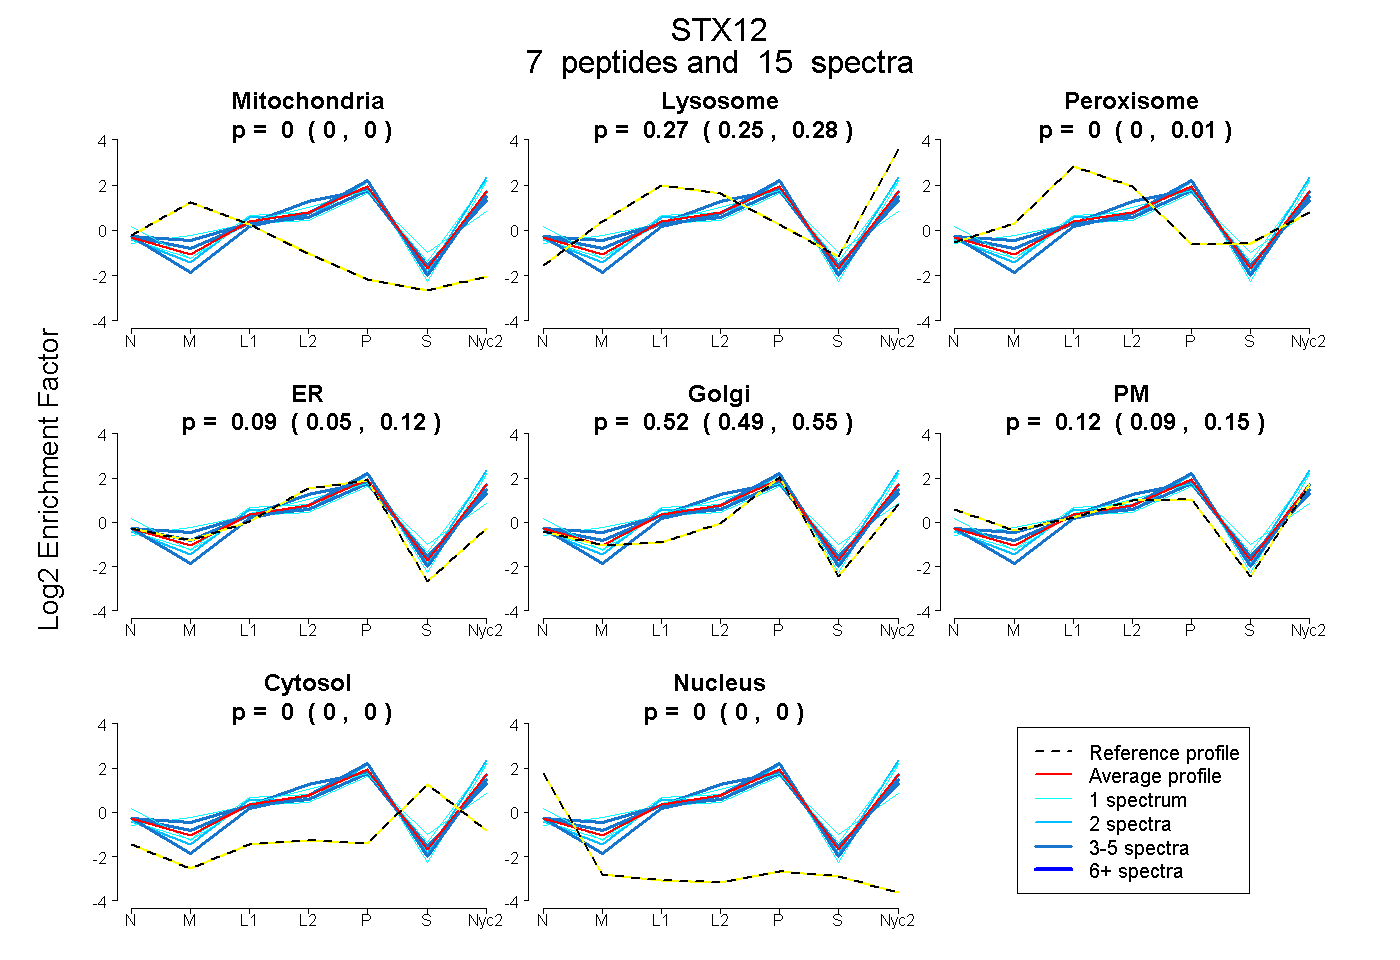
0.000 | 0.000
0.249 | 0.280
0.000 | 0.014
0.051 | 0.123
0.488 | 0.546
0.092 | 0.146
0.000 | 0.000
0.000 | 0.000
| Plot | Mito | Lyso | Perox | ER | Golgi | PM | Cytosol | Nucleus | |||||
| Expt A |
7 peptides |
15 spectra |
|
0.000 0.000 | 0.000 |
0.269 0.249 | 0.280 |
0.000 0.000 | 0.014 |
0.092 0.051 | 0.123 |
0.517 0.488 | 0.546 |
0.121 0.092 | 0.146 |
0.000 0.000 | 0.000 |
0.000 0.000 | 0.000 |
| 3 spectra, ISQATAQIK | 0.000 | 0.247 | 0.000 | 0.358 | 0.237 | 0.131 | 0.027 | 0.000 | ||
| 1 spectrum, ASDQLQR | 0.000 | 0.293 | 0.000 | 0.042 | 0.511 | 0.153 | 0.000 | 0.000 | ||
| 1 spectrum, DFNSIIQTCSGNIQR | 0.000 | 0.072 | 0.272 | 0.000 | 0.609 | 0.000 | 0.048 | 0.000 | ||
| 2 spectra, AAYYQK | 0.000 | 0.338 | 0.000 | 0.000 | 0.618 | 0.044 | 0.000 | 0.000 | ||
| 3 spectra, NPGPSGPQPR | 0.000 | 0.189 | 0.000 | 0.082 | 0.661 | 0.068 | 0.000 | 0.000 | ||
| 1 spectrum, NLMSQLGTK | 0.000 | 0.239 | 0.000 | 0.000 | 0.293 | 0.441 | 0.027 | 0.000 | ||
| 4 spectra, ETNELLK | 0.000 | 0.194 | 0.101 | 0.000 | 0.588 | 0.117 | 0.000 | 0.000 |
| Plot | Mito | Lyso or Perox | ER | Golgi | PM | Cytosol | Nucleus | ||||||
| Expt B |
3 peptides |
4 spectra |
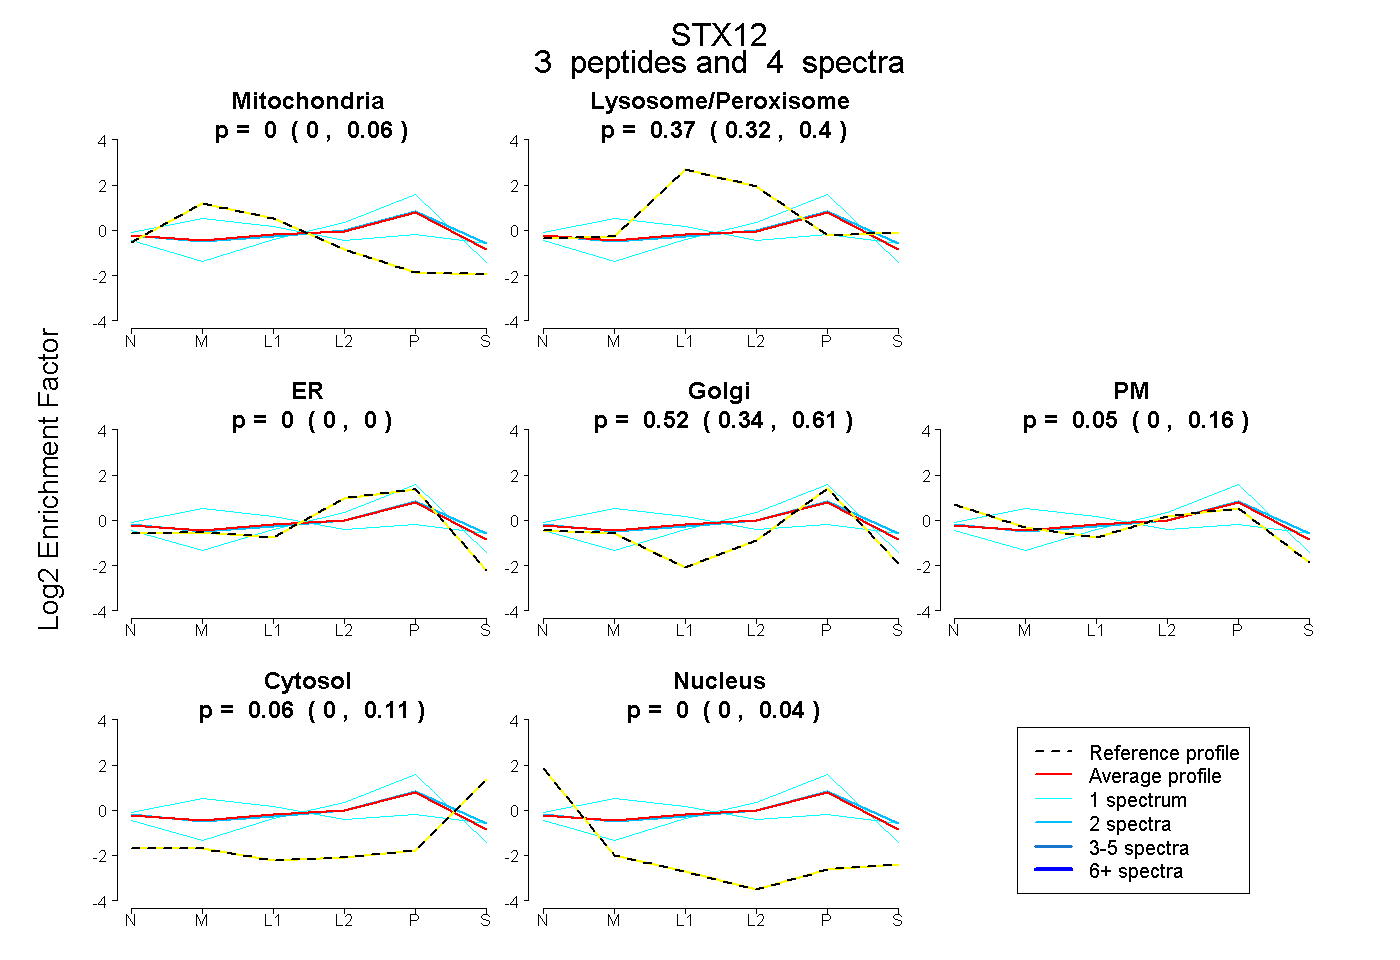 |
0.000 0.000 | 0.056 |
0.370 0.315 | 0.402 |
0.000 0.000 | 0.000 |
0.525 0.335 | 0.614 |
0.048 0.000 | 0.165 |
0.057 0.000 | 0.113 |
0.000 0.000 | 0.036 |
|||
| Plot | Lyso | Other | |||||||||||
| Expt C |
7 peptides |
52 spectra |
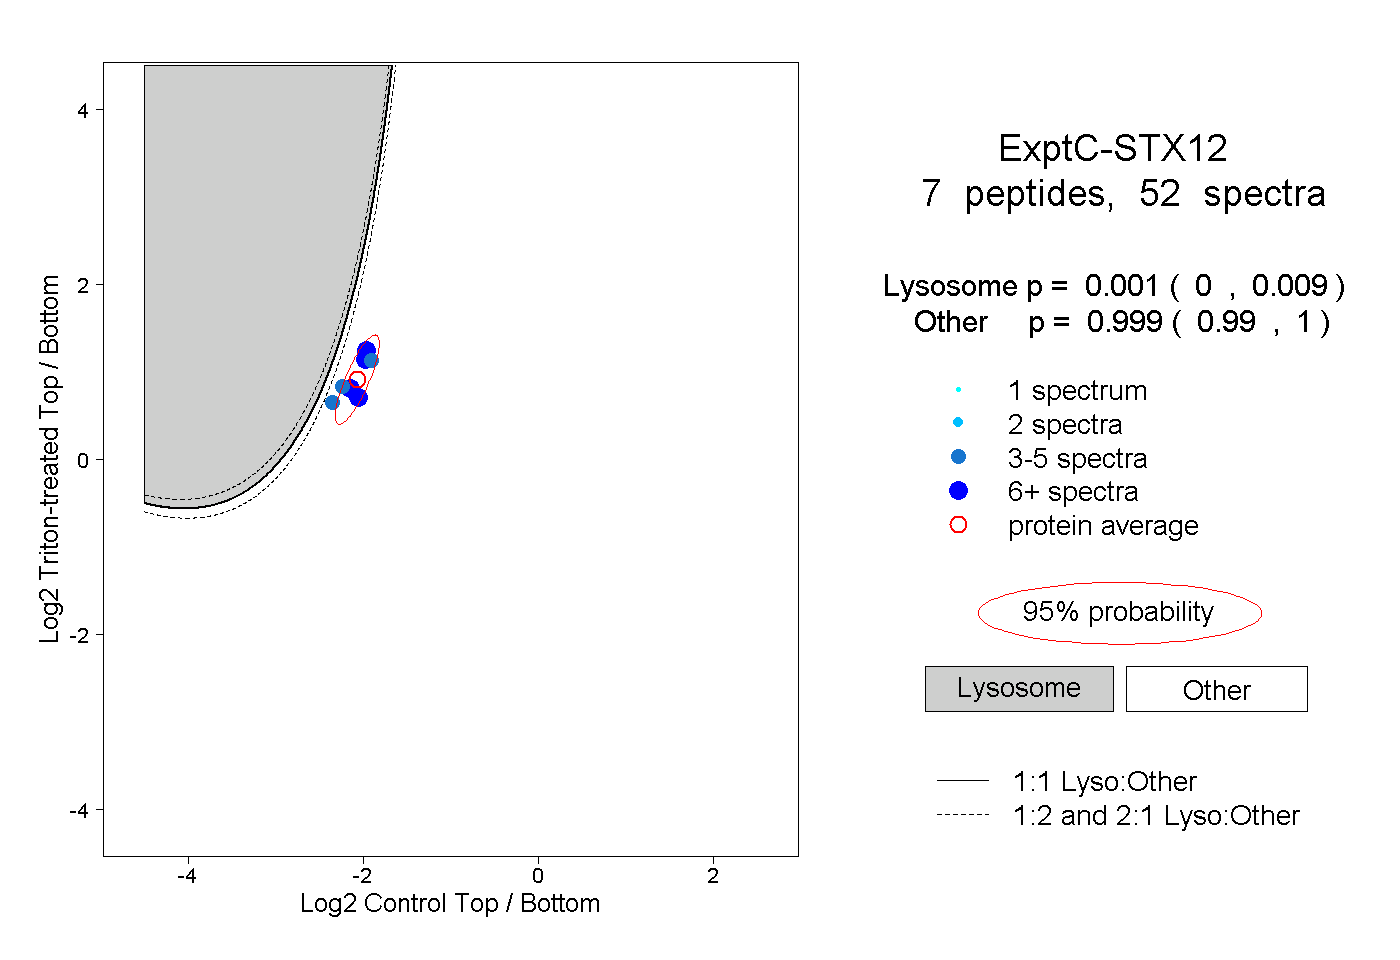 |
0.001 0.000 | 0.009 |
0.999 0.990 | 1.000 |
||||||||
| Plot | Lyso | Other | |||||||||||
| Expt D |
3 peptides |
5 spectra |
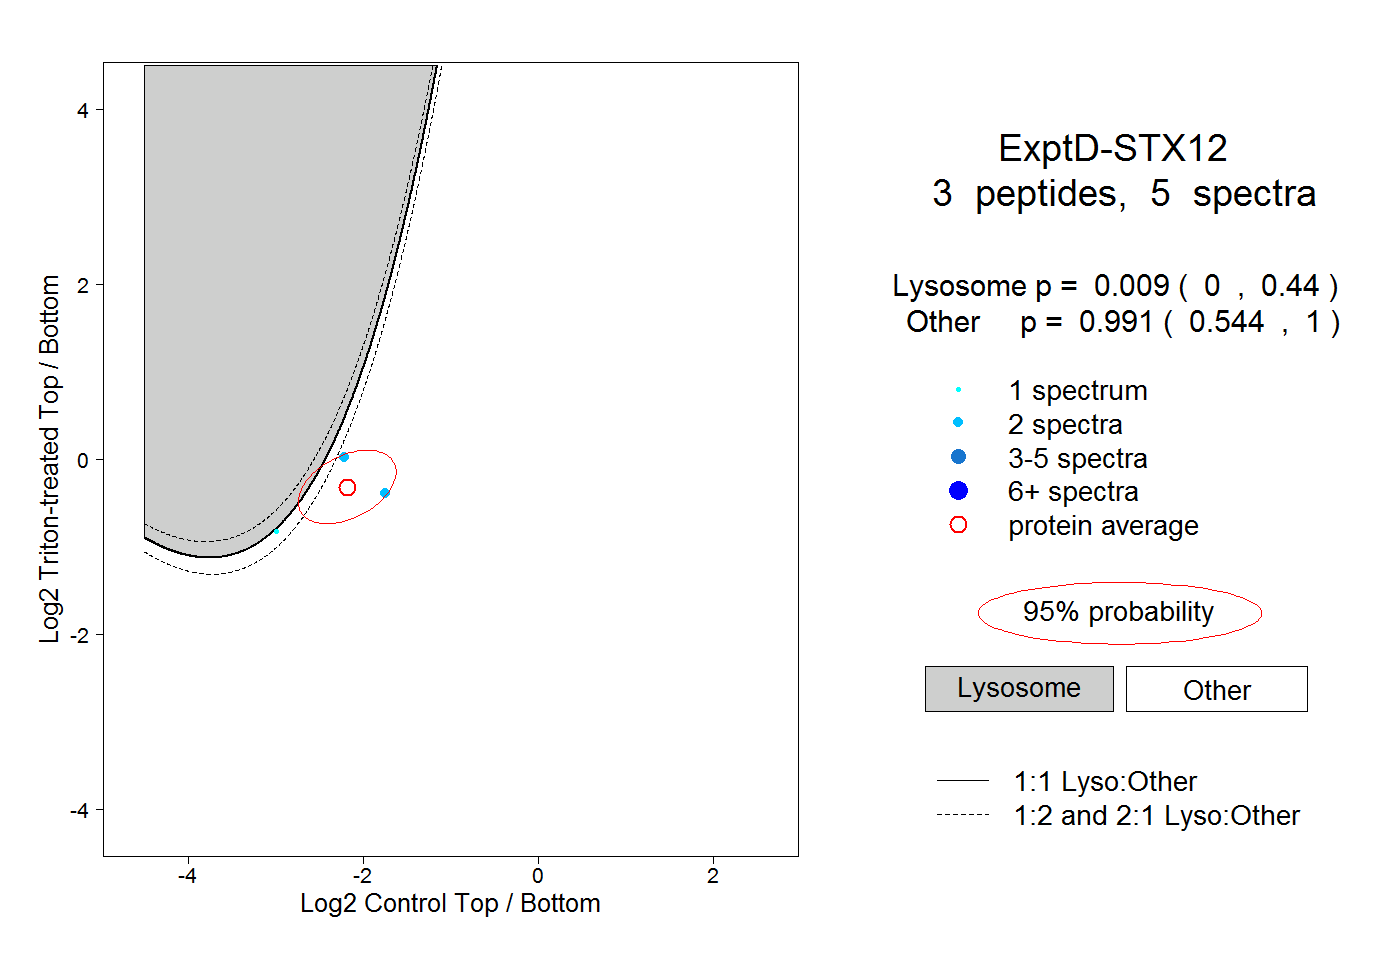 |
0.009 0.000 | 0.440 |
0.991 0.544 | 1.000 |