 4
4peptides
spectra
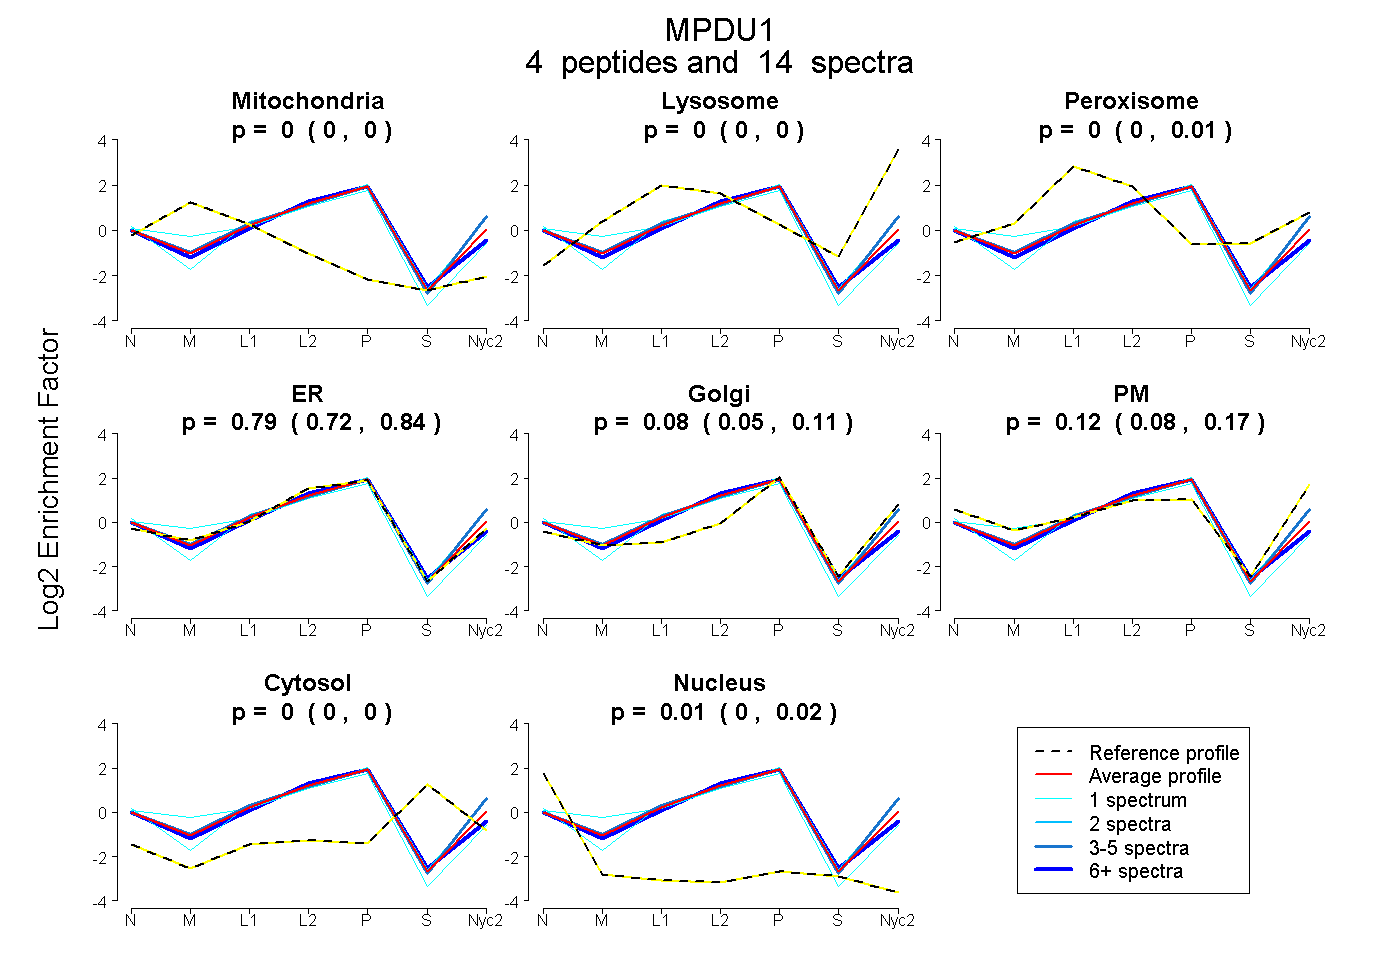
0.000 | 0.000
0.000 | 0.000
0.000 | 0.008
0.723 | 0.838
0.047 | 0.109
0.079 | 0.166
0.000 | 0.000
0.000 | 0.016
3peptides
spectra
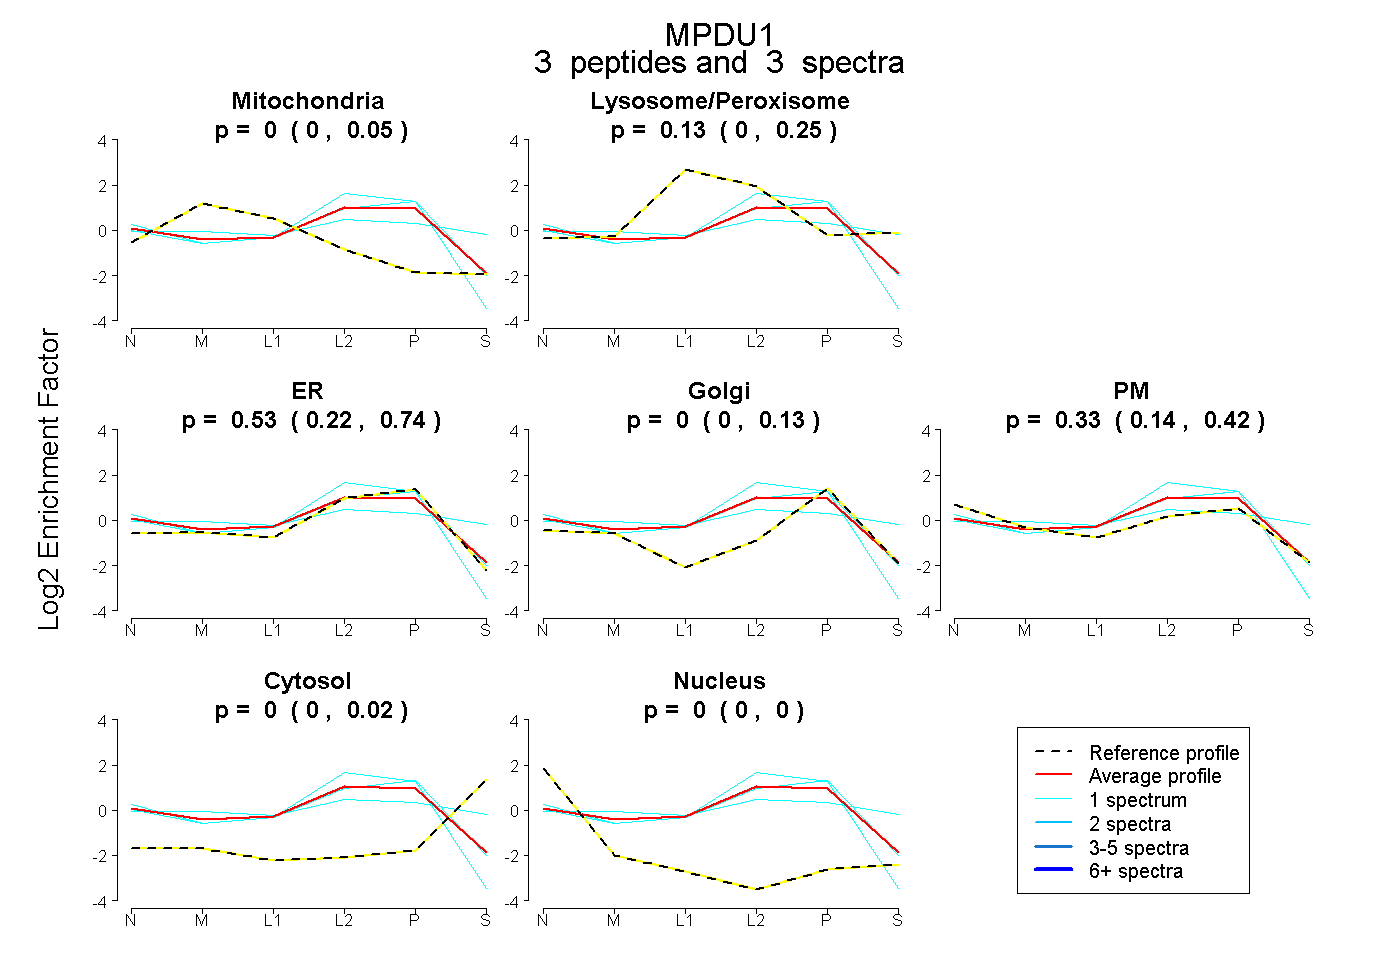
0.000 | 0.046
0.000 | 0.250
0.218 | 0.736
0.000 | 0.129
0.141 | 0.421
0.000 | 0.025
0.000 | 0.000
2peptides
spectra
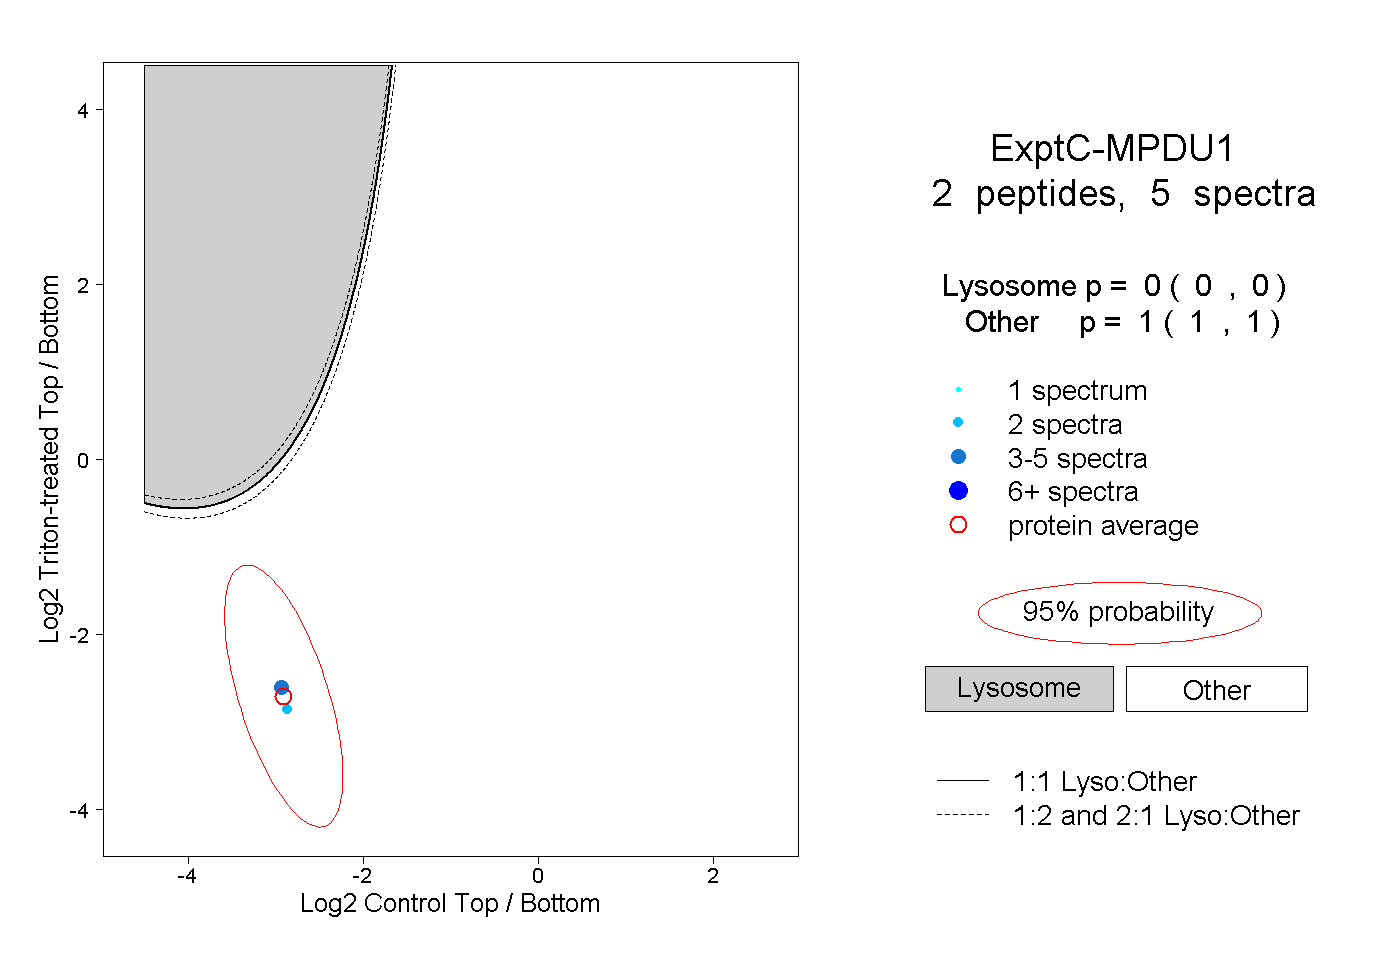
0.000 | 0.000
1.000 | 1.000