 12
12peptides
spectra
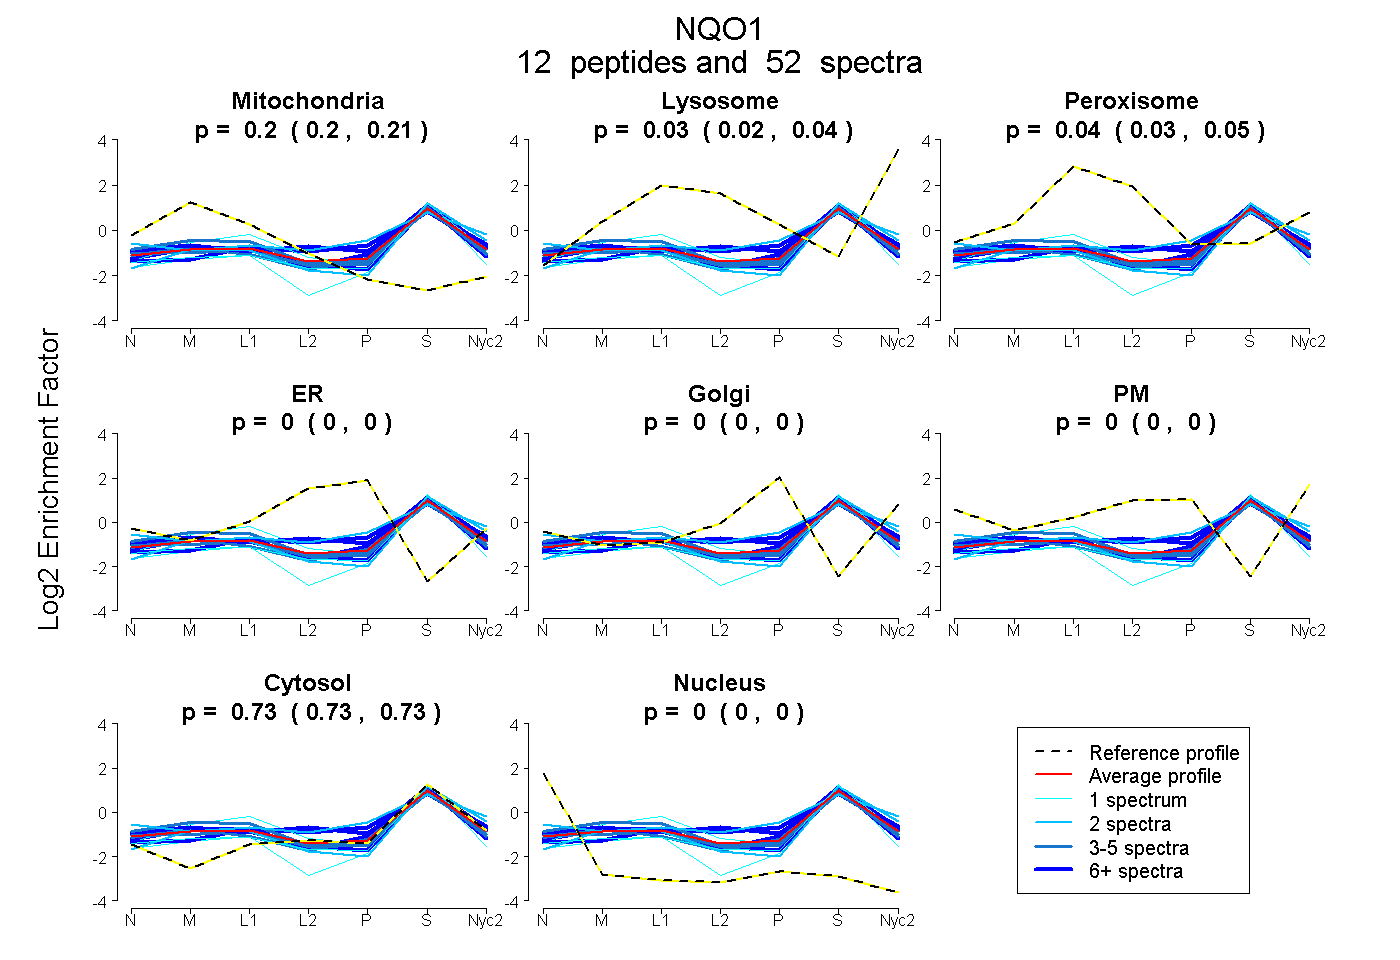
0.197 | 0.205
0.024 | 0.038
0.029 | 0.047
0.000 | 0.000
0.000 | 0.000
0.000 | 0.000
0.725 | 0.731
0.000 | 0.000
| Plot | Mito | Lyso | Perox | ER | Golgi | PM | Cytosol | Nucleus | |||||
| Expt A |
12 peptides |
52 spectra |
|
0.201 0.197 | 0.205 |
0.032 0.024 | 0.038 |
0.039 0.029 | 0.047 |
0.000 0.000 | 0.000 |
0.000 0.000 | 0.000 |
0.000 0.000 | 0.000 |
0.728 0.725 | 0.731 |
0.000 0.000 | 0.000 |
| 3 spectra, GPFQNK | 0.240 | 0.008 | 0.000 | 0.000 | 0.000 | 0.000 | 0.752 | 0.000 | ||
| 1 spectrum, VQVLEGWK | 0.170 | 0.000 | 0.000 | 0.000 | 0.000 | 0.000 | 0.830 | 0.000 | ||
| 1 spectrum, FCGFQVLEPQLVYSIGHTPPDAR | 0.211 | 0.000 | 0.140 | 0.000 | 0.000 | 0.000 | 0.649 | 0.000 | ||
| 1 spectrum, DSENFQYPVESSLAYK | 0.151 | 0.000 | 0.000 | 0.000 | 0.000 | 0.000 | 0.827 | 0.023 | ||
| 4 spectra, LSPDIVAEQK | 0.229 | 0.000 | 0.015 | 0.000 | 0.000 | 0.000 | 0.757 | 0.000 | ||
| 10 spectra, EAAVEALK | 0.254 | 0.000 | 0.003 | 0.000 | 0.000 | 0.000 | 0.743 | 0.000 | ||
| 2 spectra, TSFNYAMK | 0.175 | 0.052 | 0.000 | 0.000 | 0.000 | 0.000 | 0.773 | 0.000 | ||
| 2 spectra, VLVAGFAYTYATMYDK | 0.061 | 0.028 | 0.089 | 0.000 | 0.023 | 0.152 | 0.647 | 0.000 | ||
| 9 spectra, ALIVLAHAER | 0.132 | 0.000 | 0.135 | 0.000 | 0.072 | 0.000 | 0.661 | 0.000 | ||
| 5 spectra, SIPADNQIK | 0.264 | 0.004 | 0.091 | 0.000 | 0.000 | 0.000 | 0.642 | 0.000 | ||
| 8 spectra, NDITGEPK | 0.157 | 0.048 | 0.104 | 0.000 | 0.027 | 0.000 | 0.664 | 0.000 | ||
| 6 spectra, FGLSVGHHLGK | 0.136 | 0.062 | 0.000 | 0.000 | 0.000 | 0.000 | 0.802 | 0.000 |
| Plot | Mito | Lyso or Perox | ER | Golgi | PM | Cytosol | Nucleus | ||||||
| Expt B |
2 peptides |
10 spectra |
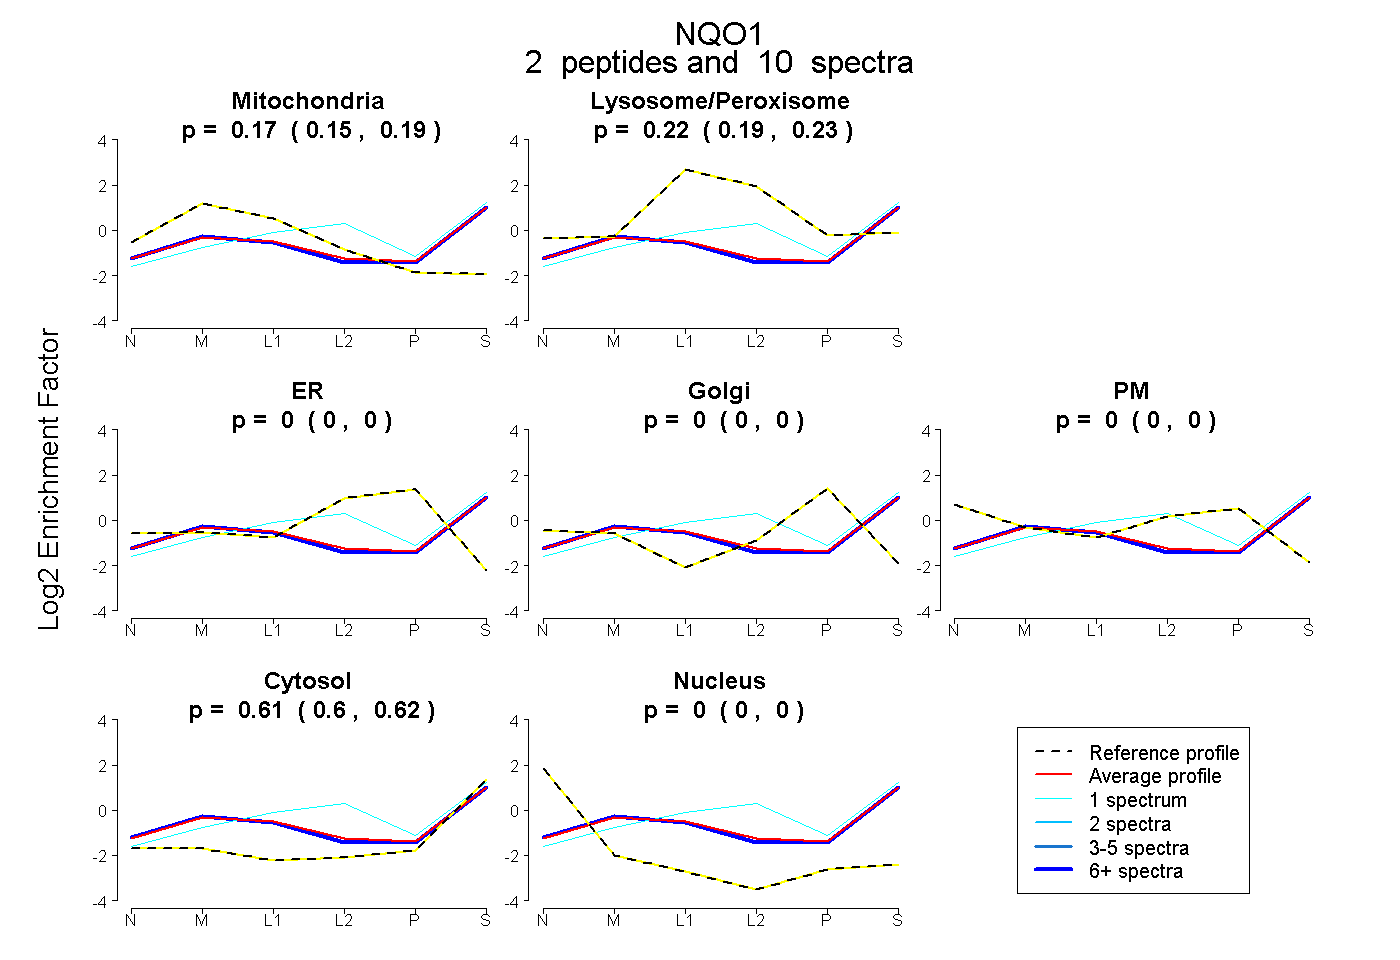 |
0.172 0.152 | 0.190 |
0.216 0.193 | 0.235 |
0.000 0.000 | 0.000 |
0.000 0.000 | 0.000 |
0.000 0.000 | 0.000 |
0.612 0.600 | 0.621 |
0.000 0.000 | 0.000 |
|||
| Plot | Lyso | Other | |||||||||||
| Expt C |
10 peptides |
50 spectra |
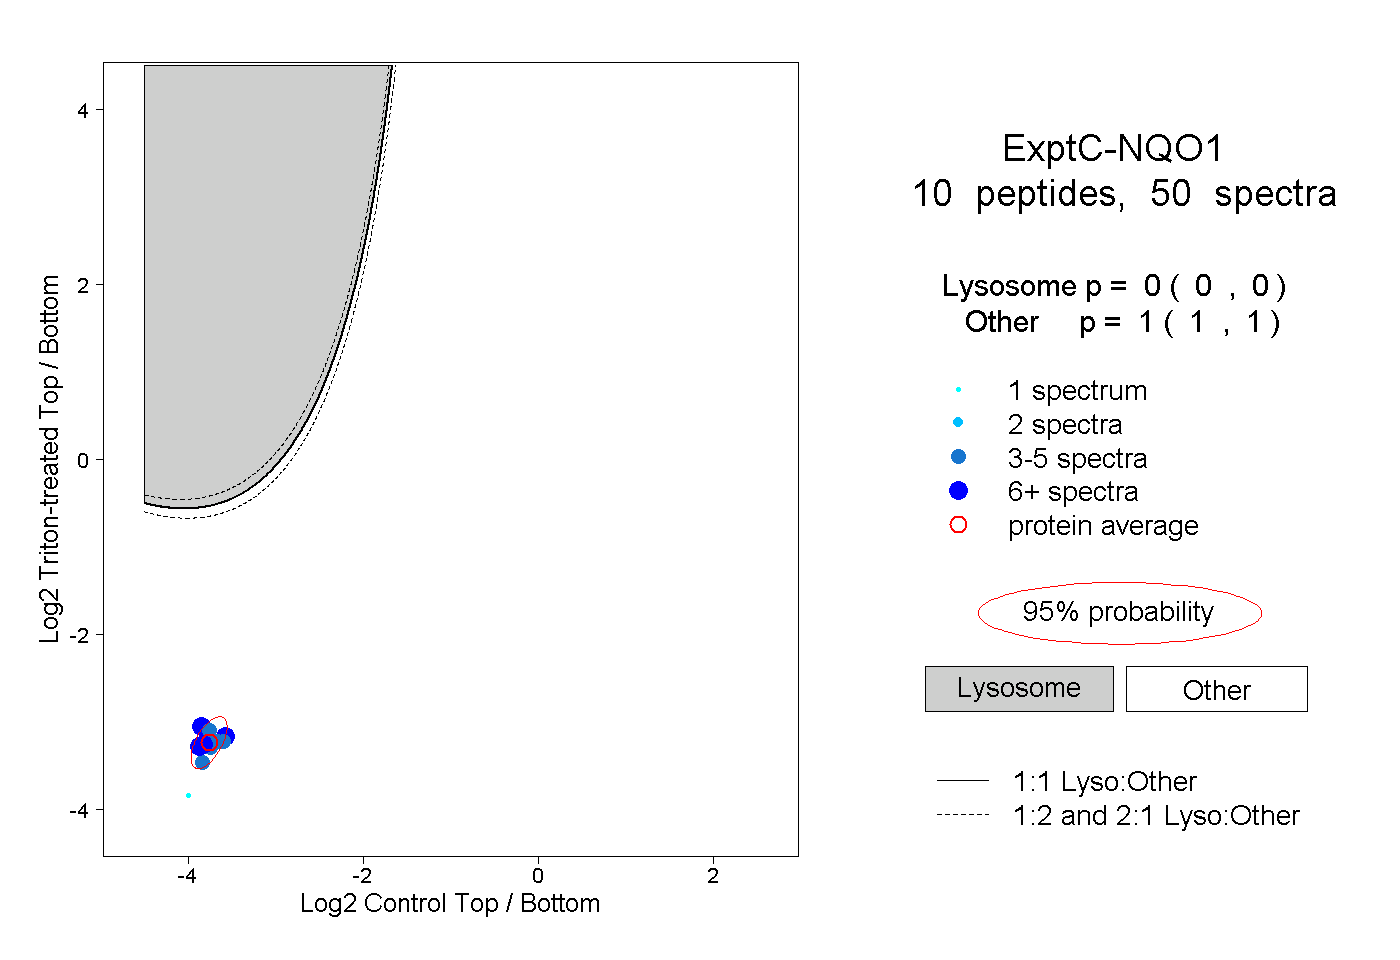 |
0.000 0.000 | 0.000 |
1.000 1.000 | 1.000 |
||||||||
| Plot | Lyso | Other | |||||||||||
| Expt D |
3 peptides |
5 spectra |
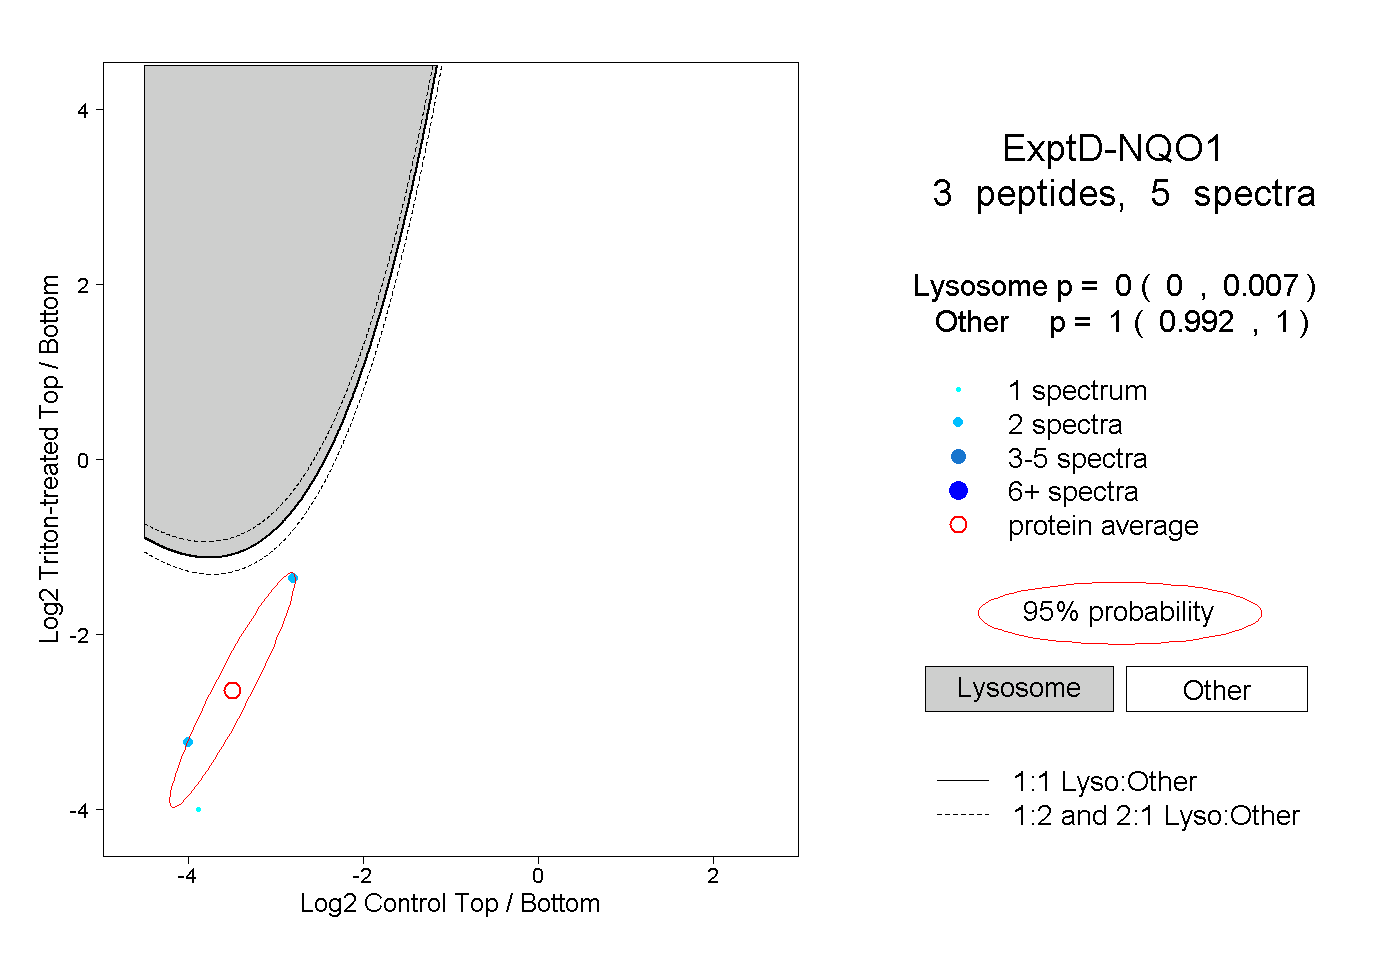 |
0.000 0.000 | 0.007 |
1.000 0.992 | 1.000 |