 1
1peptide
spectra
0.000 | 0.000
0.000 | 0.000
0.000 | 0.000
0.251 | 0.286
0.000 | 0.000
0.000 | 0.000
0.449 | 0.488
0.234 | 0.283
1peptide
spectra
NA | NA
NA | NA
NA | NA
NA | NA
NA | NA
NA | NA
NA | NA
| Plot | Mito | Lyso | Perox | ER | Golgi | PM | Cytosol | Nucleus | |||||
| Expt A |
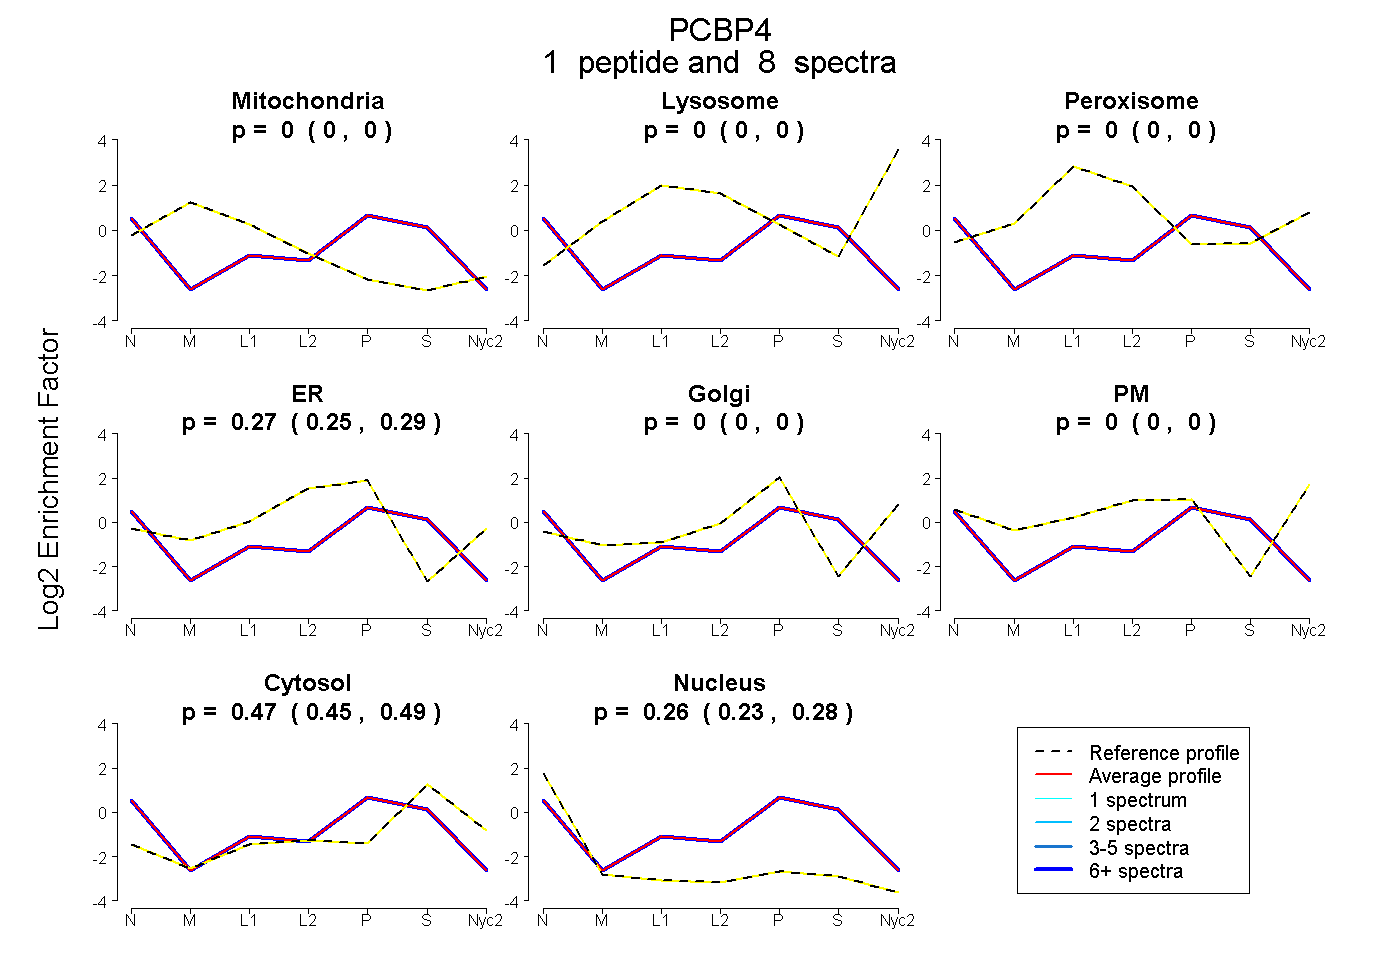
1 peptide |
8 spectra |
|
0.000 0.000 | 0.000 |
0.000 0.000 | 0.000 |
0.000 0.000 | 0.000 |
0.270 0.251 | 0.286 |
0.000 0.000 | 0.000 |
0.000 0.000 | 0.000 |
0.469 0.449 | 0.488 |
0.261 0.234 | 0.283 |
||
| Plot | Mito | Lyso or Perox | ER | Golgi | PM | Cytosol | Nucleus | ||||||
| Expt B |
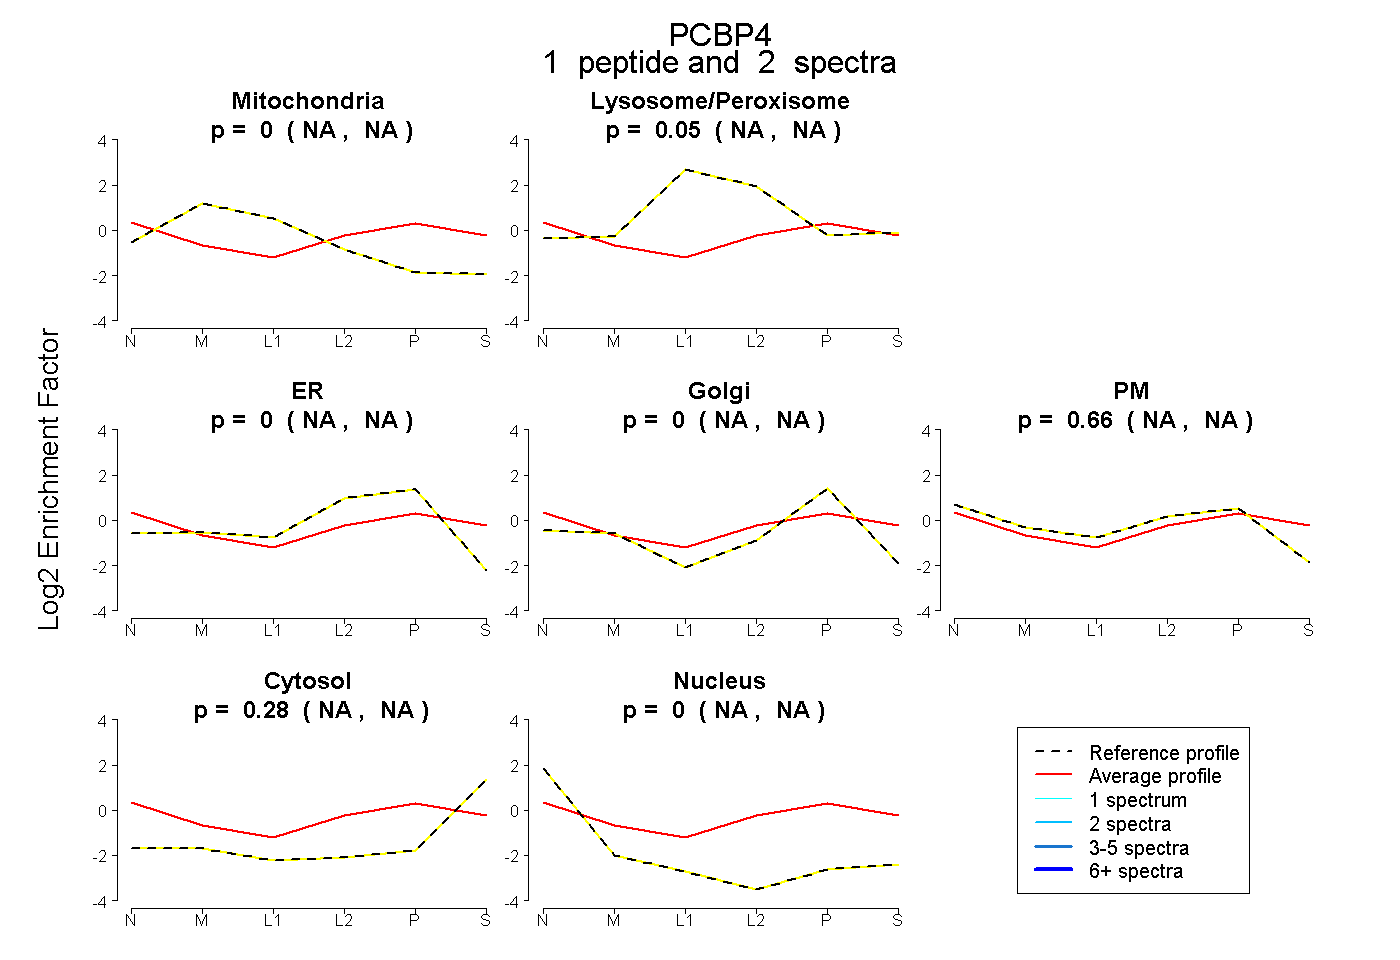
1 peptide |
2 spectra |
|
0.000 NA | NA |
0.055 NA | NA |
0.000 NA | NA |
0.005 NA | NA |
0.656 NA | NA |
0.284 NA | NA |
0.000 NA | NA |