 8
8peptides
spectra
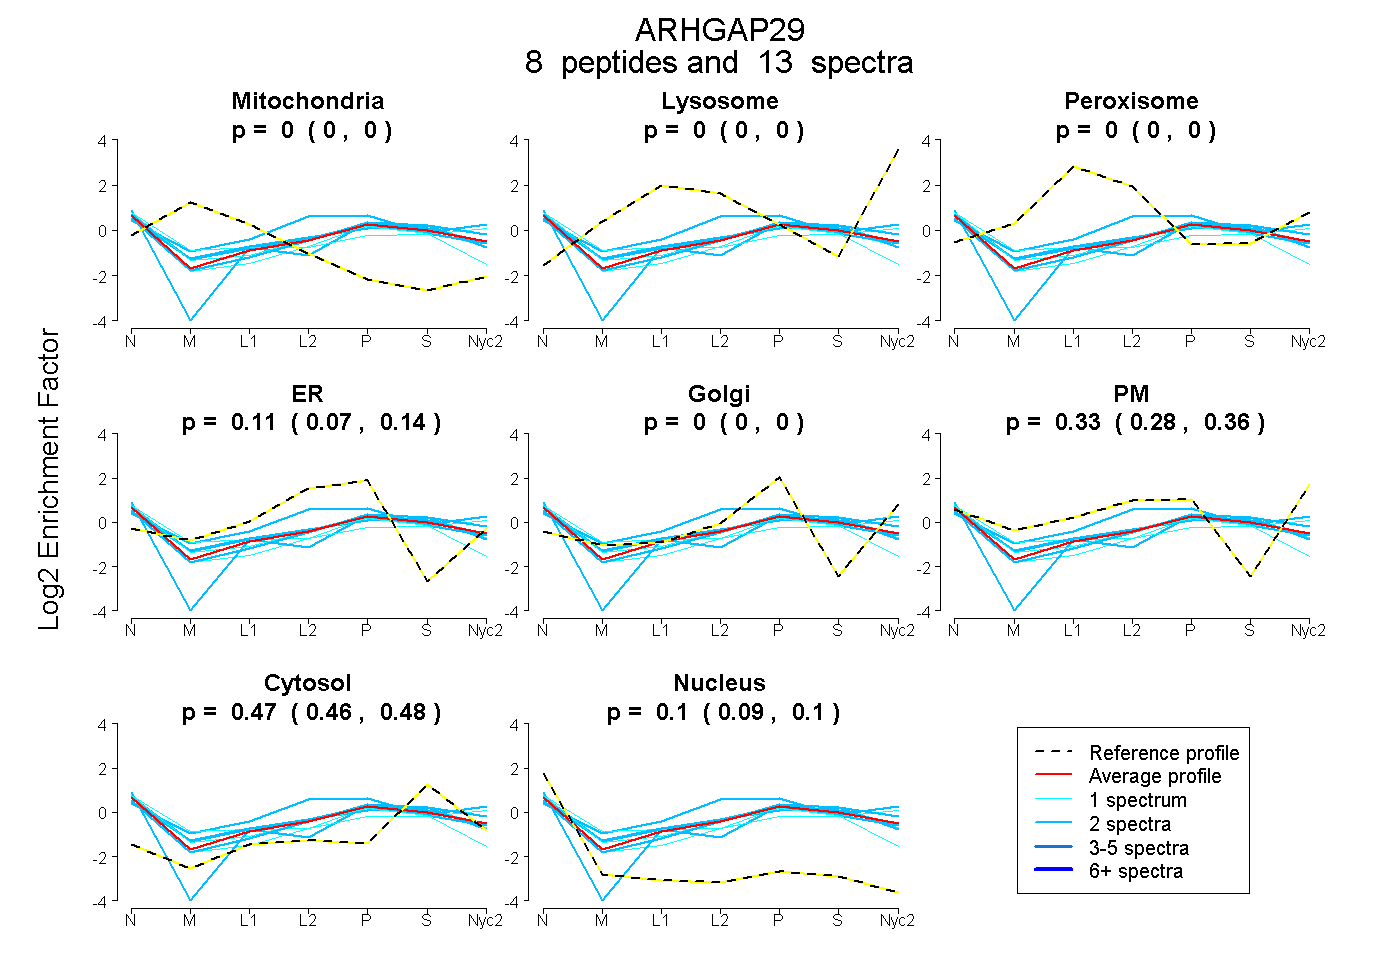
0.000 | 0.000
0.000 | 0.000
0.000 | 0.000
0.070 | 0.141
0.000 | 0.000
0.282 | 0.361
0.458 | 0.478
0.086 | 0.104
| Plot | Mito | Lyso | Perox | ER | Golgi | PM | Cytosol | Nucleus | |||||
| Expt A |
8 peptides |
13 spectra |
|
0.000 0.000 | 0.000 |
0.000 0.000 | 0.000 |
0.000 0.000 | 0.000 |
0.109 0.070 | 0.141 |
0.000 0.000 | 0.000 |
0.325 0.282 | 0.361 |
0.470 0.458 | 0.478 |
0.096 0.086 | 0.104 |
| 2 spectra, NIVSWVEK | 0.000 | 0.000 | 0.033 | 0.000 | 0.000 | 0.419 | 0.503 | 0.046 | ||
| 2 spectra, VEEANEHYK | 0.000 | 0.000 | 0.000 | 0.211 | 0.028 | 0.156 | 0.515 | 0.091 | ||
| 2 spectra, FVQPLLGR | 0.000 | 0.000 | 0.000 | 0.000 | 0.000 | 0.513 | 0.439 | 0.049 | ||
| 2 spectra, EVIHIR | 0.000 | 0.000 | 0.000 | 0.000 | 0.230 | 0.080 | 0.539 | 0.151 | ||
| 1 spectrum, GNFSPIELDNLLLK | 0.008 | 0.000 | 0.031 | 0.000 | 0.000 | 0.447 | 0.406 | 0.108 | ||
| 2 spectra, FSHVLLYLK | 0.000 | 0.000 | 0.118 | 0.394 | 0.000 | 0.102 | 0.359 | 0.026 | ||
| 1 spectrum, EILTQLR | 0.000 | 0.000 | 0.000 | 0.026 | 0.137 | 0.230 | 0.442 | 0.165 | ||
| 1 spectrum, VCVTNVEER | 0.000 | 0.000 | 0.059 | 0.357 | 0.000 | 0.000 | 0.383 | 0.201 |
| Plot | Lyso | Other | |||||||||||
| Expt C |
5 peptides |
7 spectra |
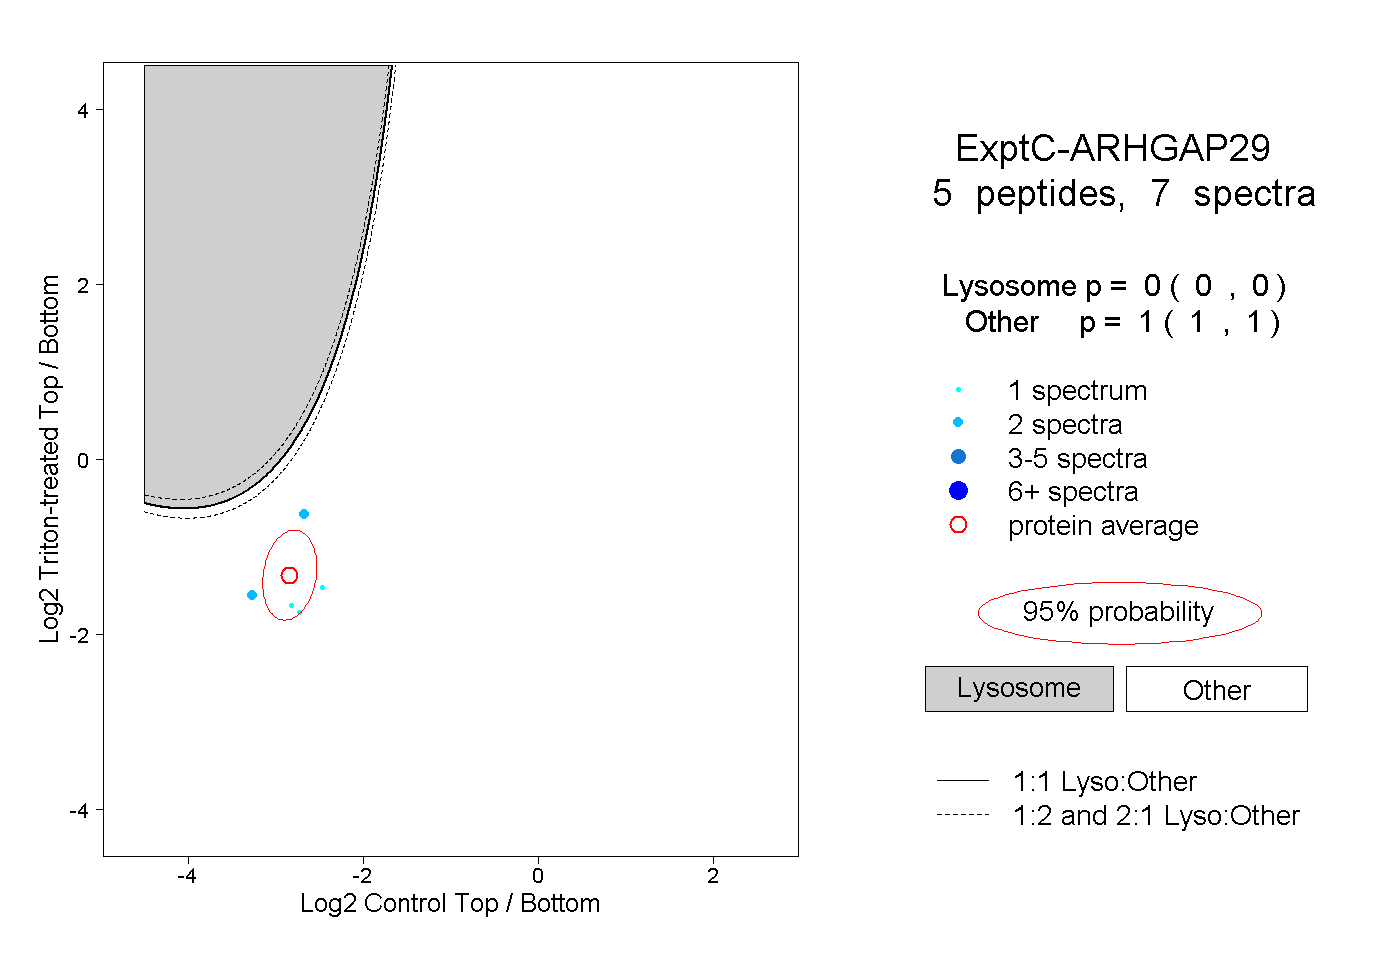 |
0.000 0.000 | 0.000 |
1.000 1.000 | 1.000 |