 5
5peptides
spectra

0.000 | 0.000
0.000 | 0.000
0.000 | 0.000
0.000 | 0.206
0.000 | 0.267
0.000 | 0.000
0.194 | 0.251
0.488 | 0.554
| Plot | Mito | Lyso | Perox | ER | Golgi | PM | Cytosol | Nucleus | |||||
| Expt A |
5 peptides |
9 spectra |
|
0.000 0.000 | 0.000 |
0.000 0.000 | 0.000 |
0.000 0.000 | 0.000 |
0.103 0.000 | 0.206 |
0.147 0.000 | 0.267 |
0.000 0.000 | 0.000 |
0.227 0.194 | 0.251 |
0.522 0.488 | 0.554 |
| 2 spectra, FATCSDDGTVR | 0.000 | 0.000 | 0.000 | 0.000 | 0.063 | 0.000 | 0.418 | 0.519 | ||
| 2 spectra, EFNEGDGR | 0.000 | 0.000 | 0.006 | 0.000 | 0.180 | 0.312 | 0.200 | 0.302 | ||
| 1 spectrum, GLVVSGSK | 0.000 | 0.000 | 0.000 | 0.196 | 0.032 | 0.000 | 0.135 | 0.637 | ||
| 2 spectra, FFHMPR | 0.000 | 0.000 | 0.000 | 0.147 | 0.000 | 0.000 | 0.132 | 0.721 | ||
| 2 spectra, GHGADVK | 0.000 | 0.000 | 0.000 | 0.051 | 0.255 | 0.000 | 0.222 | 0.472 |
| Plot | Mito | Lyso or Perox | ER | Golgi | PM | Cytosol | Nucleus | ||||||
| Expt B |
1 peptide |
1 spectrum |
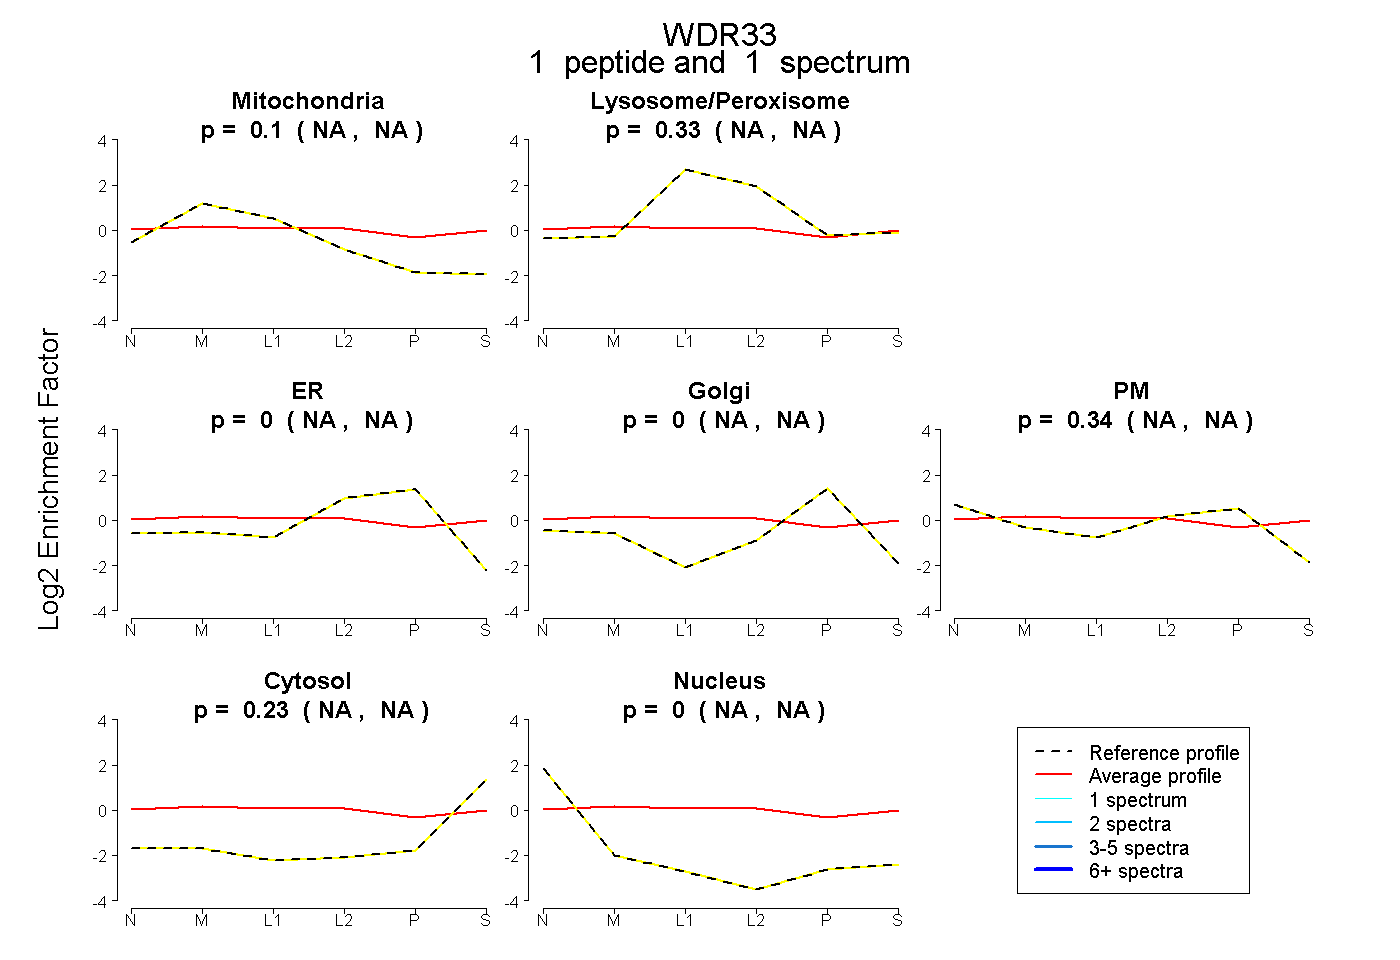 |
0.105 NA | NA |
0.329 NA | NA |
0.000 NA | NA |
0.000 NA | NA |
0.341 NA | NA |
0.225 NA | NA |
0.000 NA | NA |