 1
1peptide
spectra
0.000 | 0.000
0.537 | 0.589
0.000 | 0.000
0.000 | 0.000
0.095 | 0.189
0.121 | 0.242
0.073 | 0.118
0.000 | 0.000
2peptides
spectra
0.000 | 0.969
0.024 | 1.000
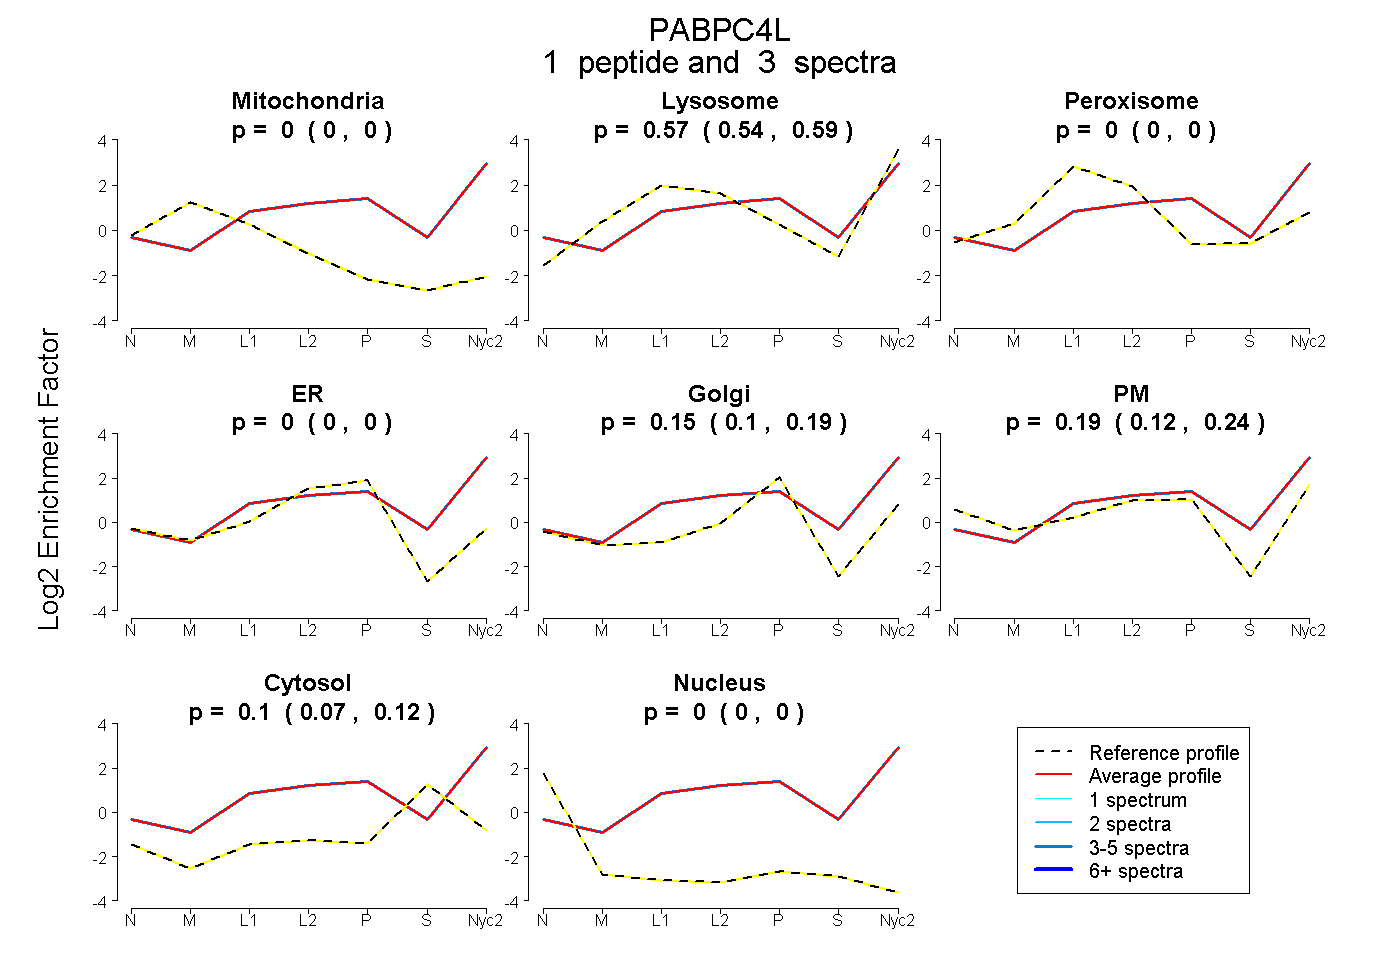
| Plot | Mito | Lyso | Perox | ER | Golgi | PM | Cytosol | Nucleus | |||||
| Expt A |
1 peptide |
3 spectra |
|
0.000 0.000 | 0.000 |
0.565 0.537 | 0.589 |
0.000 0.000 | 0.000 |
0.000 0.000 | 0.000 |
0.147 0.095 | 0.189 |
0.189 0.121 | 0.242 |
0.098 0.073 | 0.118 |
0.000 0.000 | 0.000 |
||
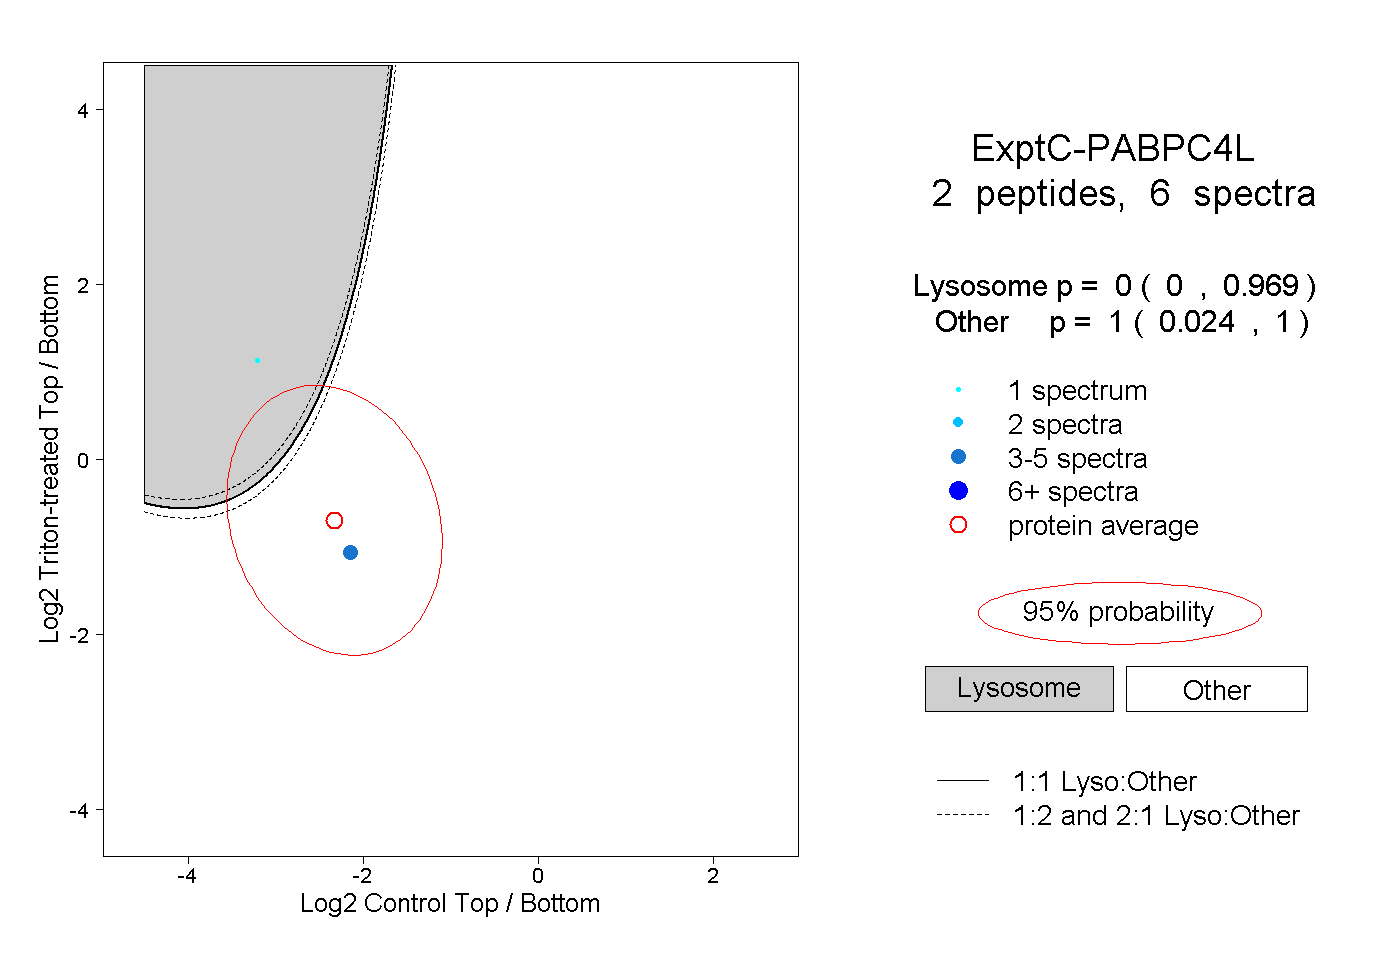
| Plot | Lyso | Other | |||||||||||
| Expt C |
2 peptides |
6 spectra |
|
0.000 0.000 | 0.969 |
1.000 0.024 | 1.000 |