 6
6peptides
spectra
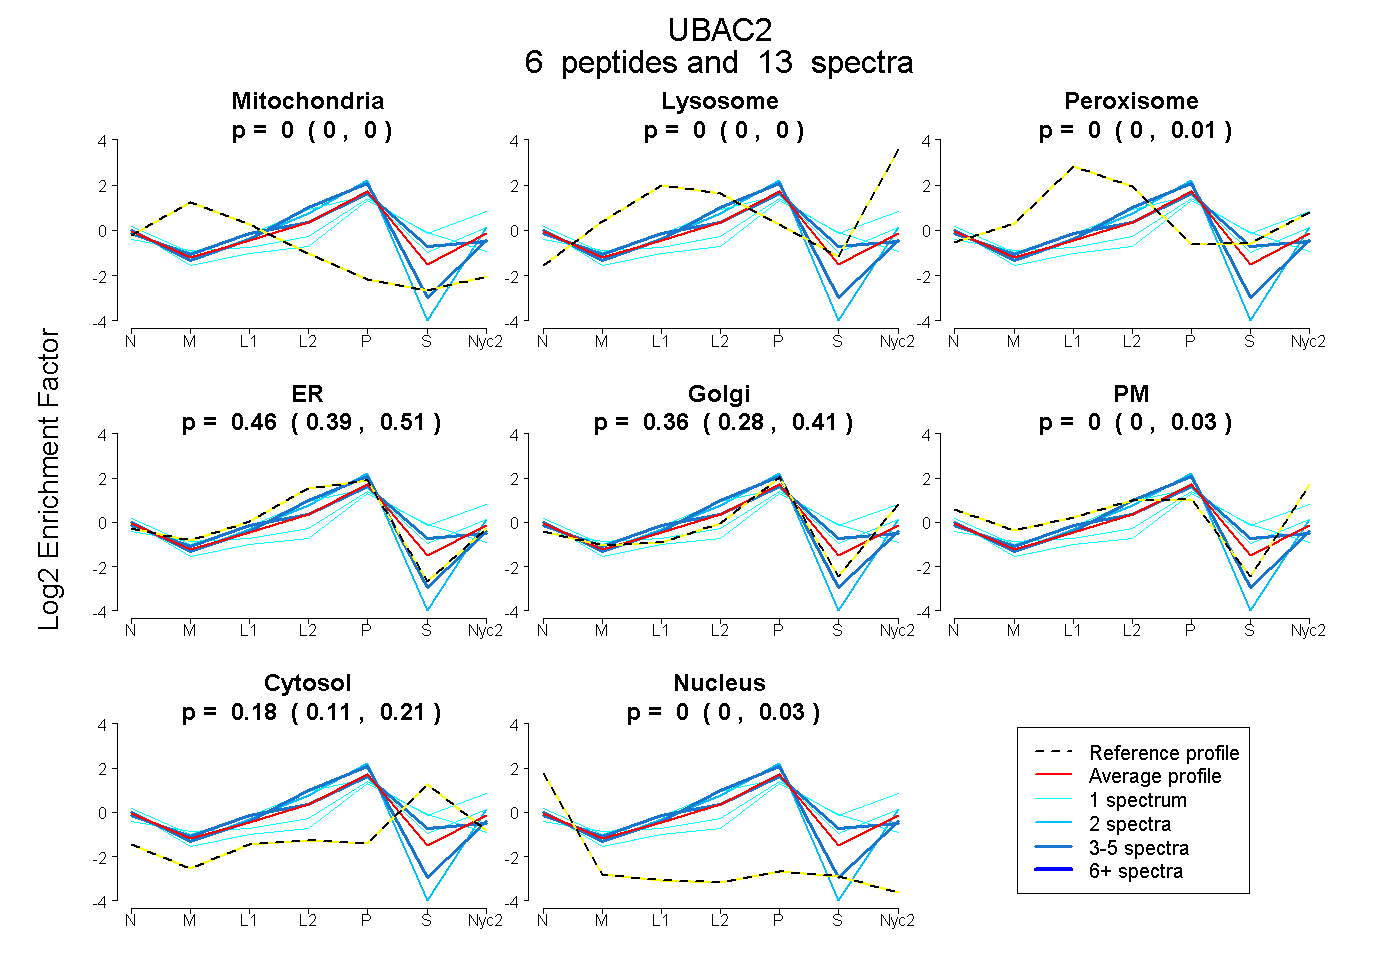
0.000 | 0.000
0.000 | 0.000
0.000 | 0.010
0.392 | 0.508
0.280 | 0.410
0.000 | 0.032
0.112 | 0.215
0.000 | 0.030
2peptides
spectra
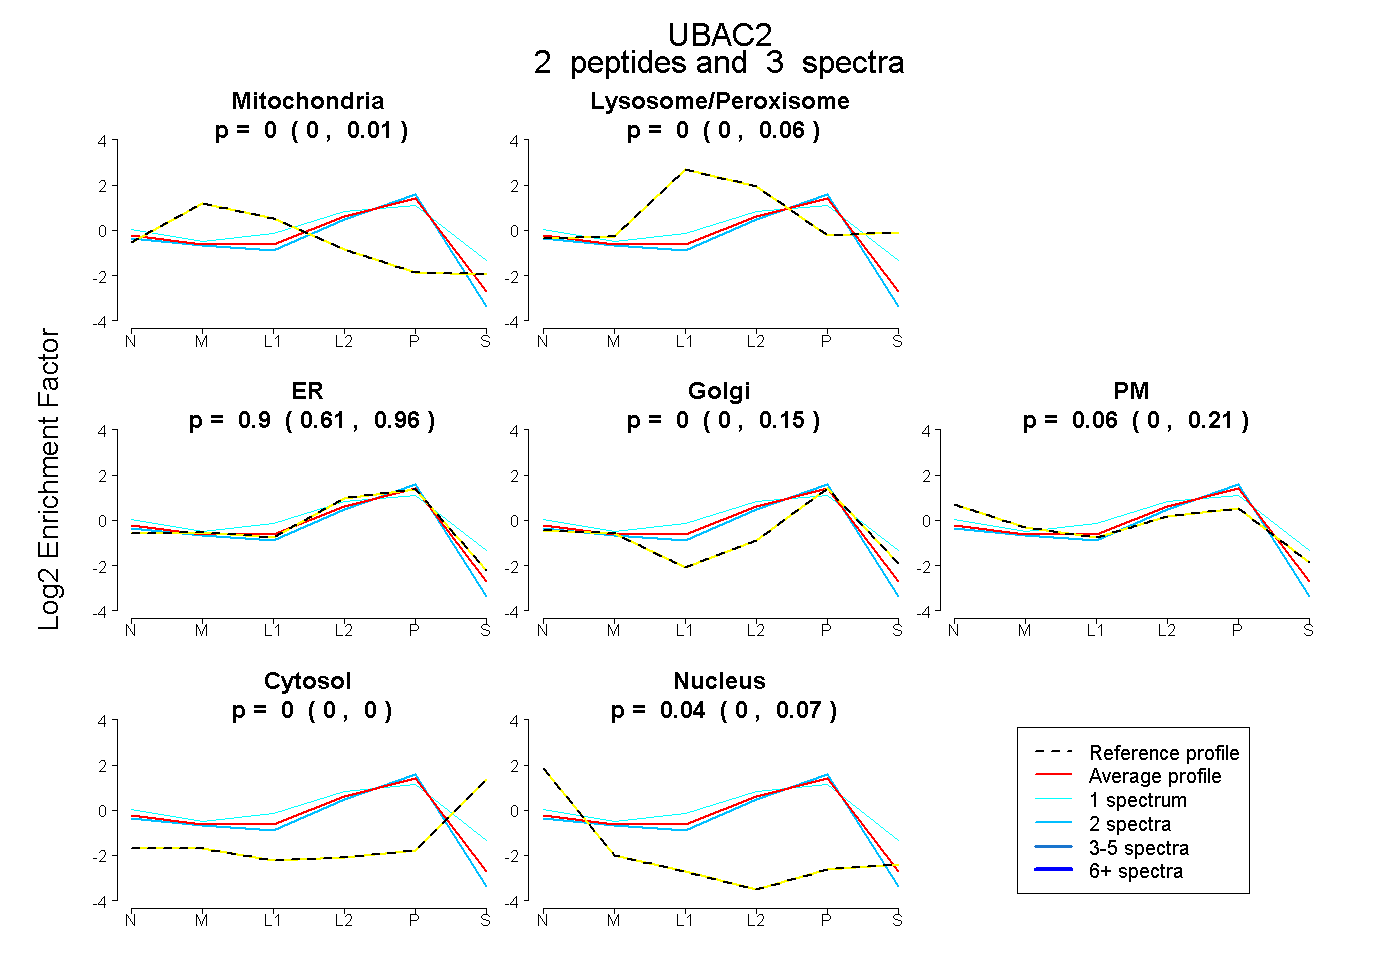
0.000 | 0.009
0.000 | 0.059
0.606 | 0.962
0.000 | 0.147
0.000 | 0.210
0.000 | 0.000
0.000 | 0.066
3peptides
spectra
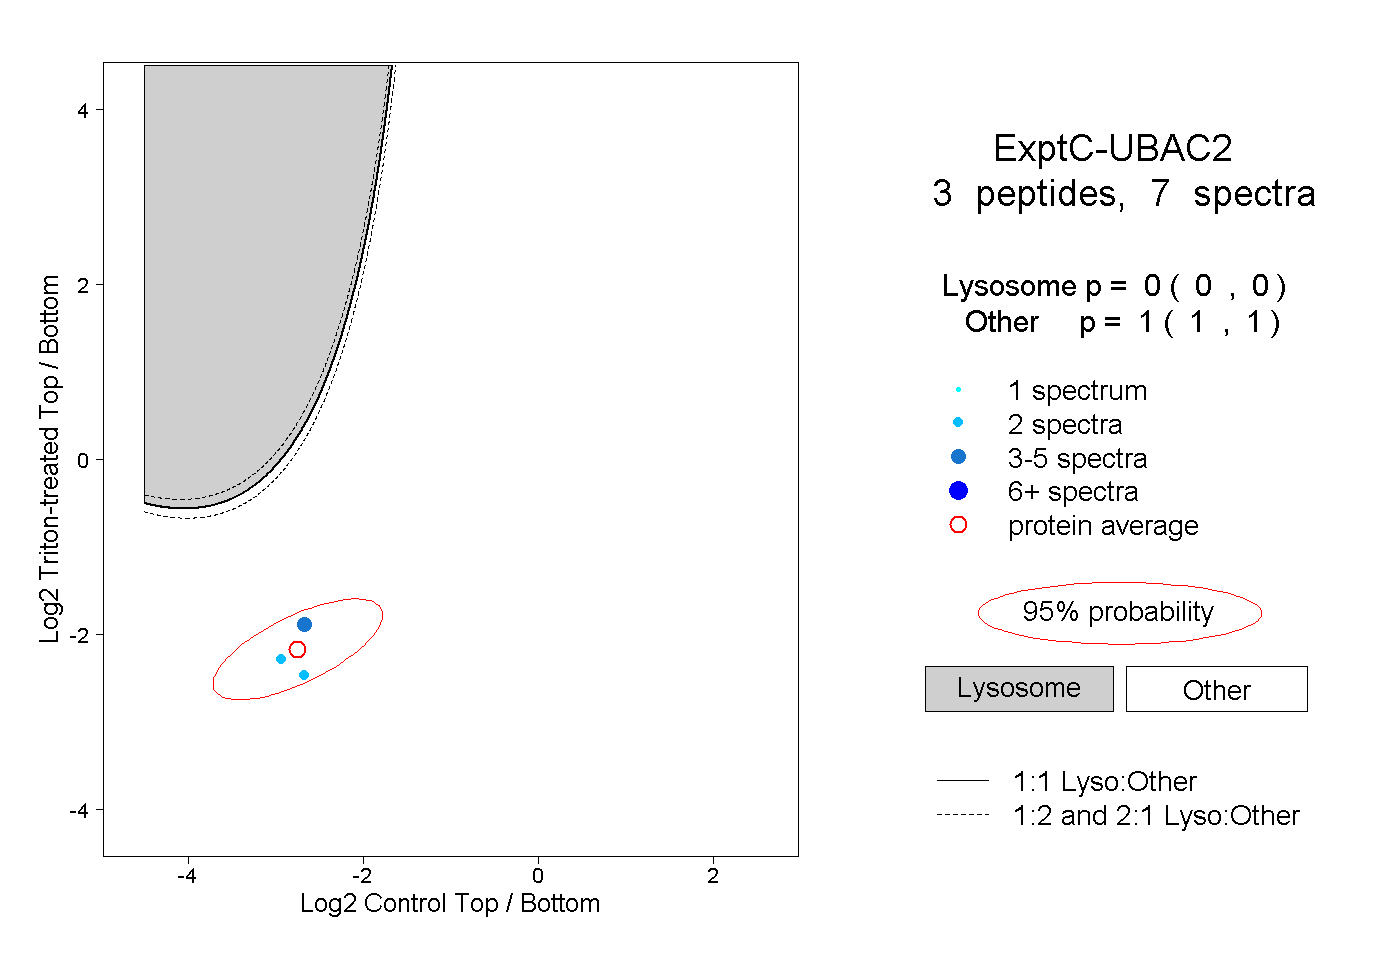
0.000 | 0.000
1.000 | 1.000