 4
4peptides
spectra
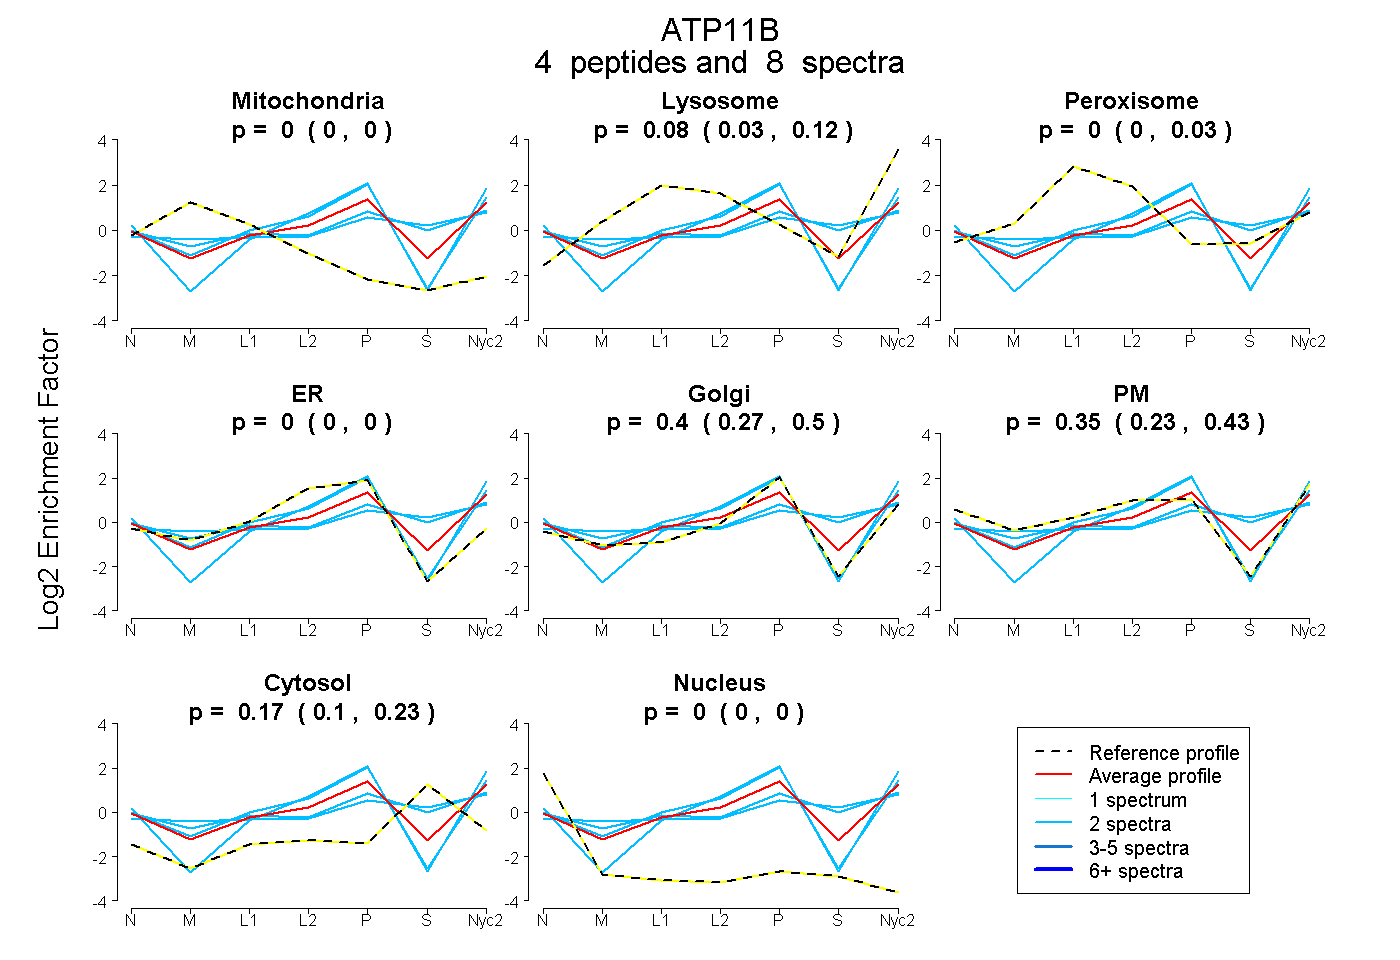
0.000 | 0.000
0.028 | 0.120
0.000 | 0.030
0.000 | 0.000
0.271 | 0.503
0.232 | 0.433
0.096 | 0.231
0.000 | 0.000
1peptide
spectrum
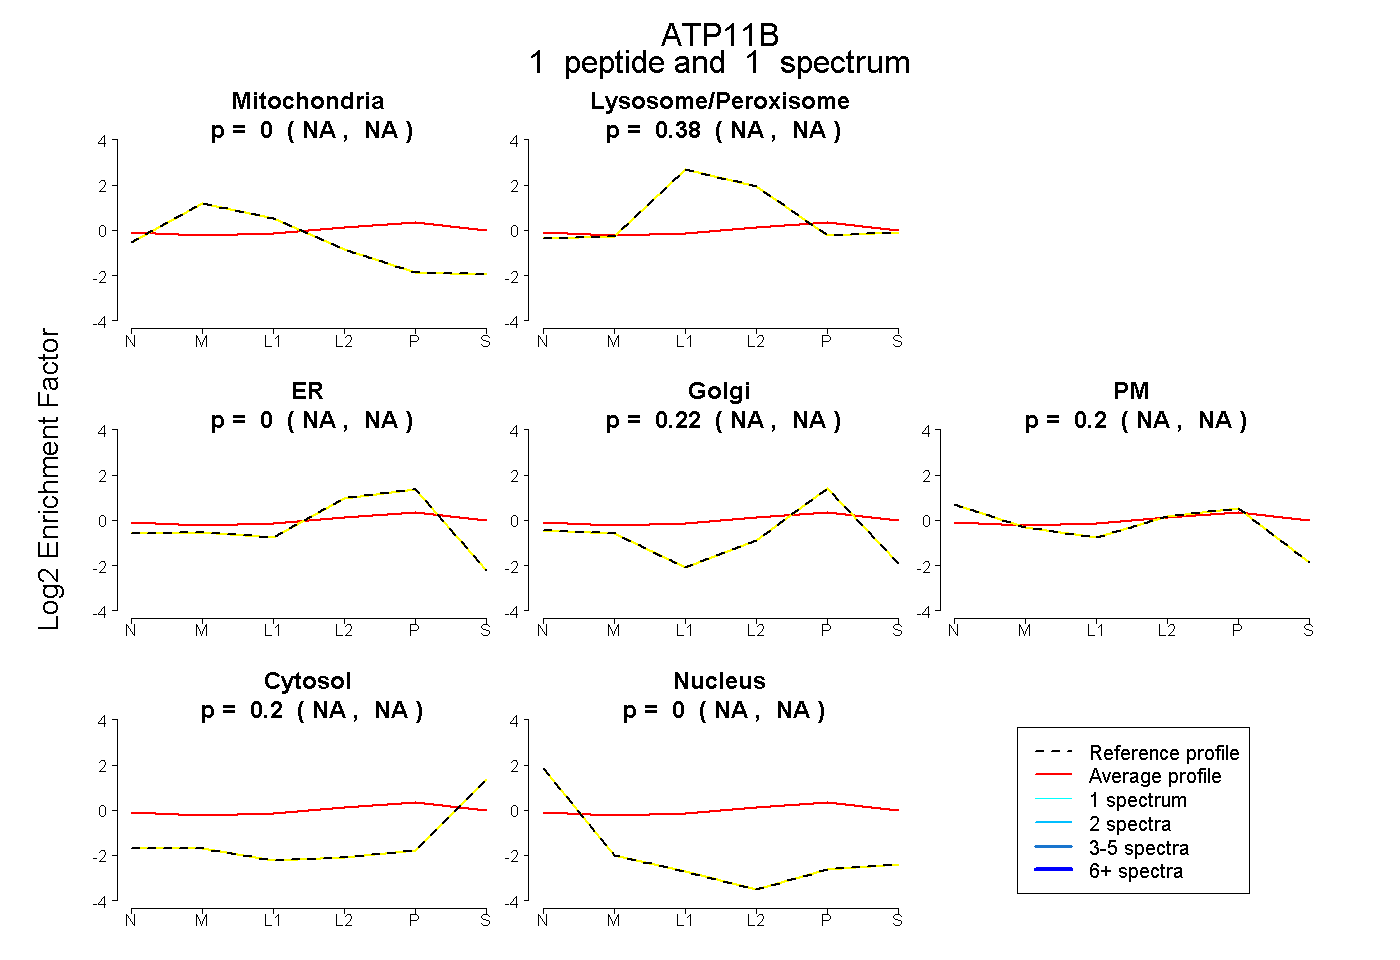
NA | NA
NA | NA
NA | NA
NA | NA
NA | NA
NA | NA
NA | NA
4peptides
spectra
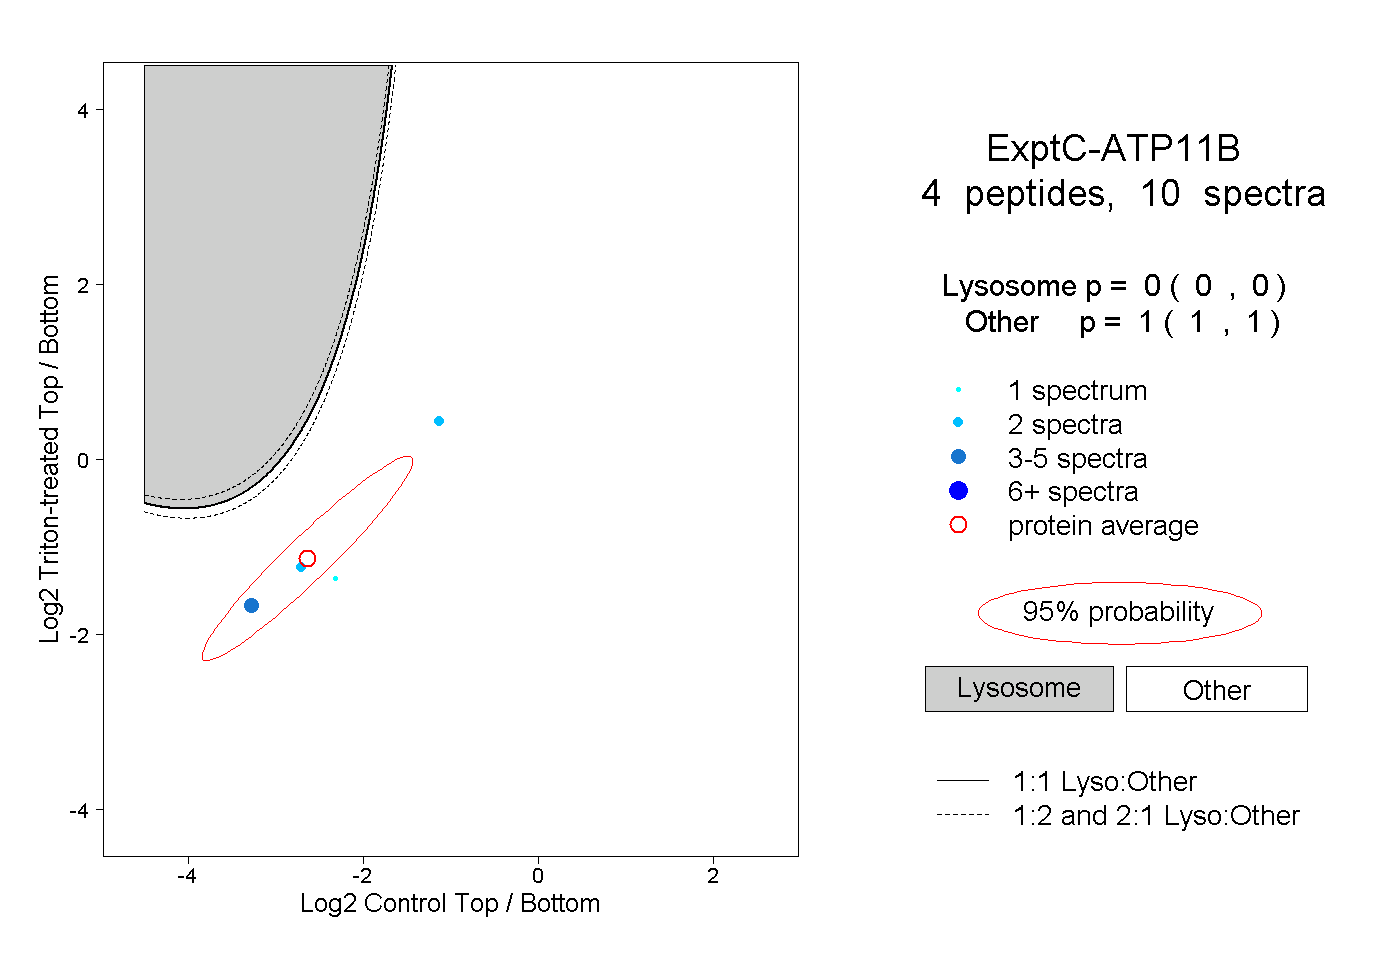
0.000 | 0.000
1.000 | 1.000