 3
3peptides
spectra
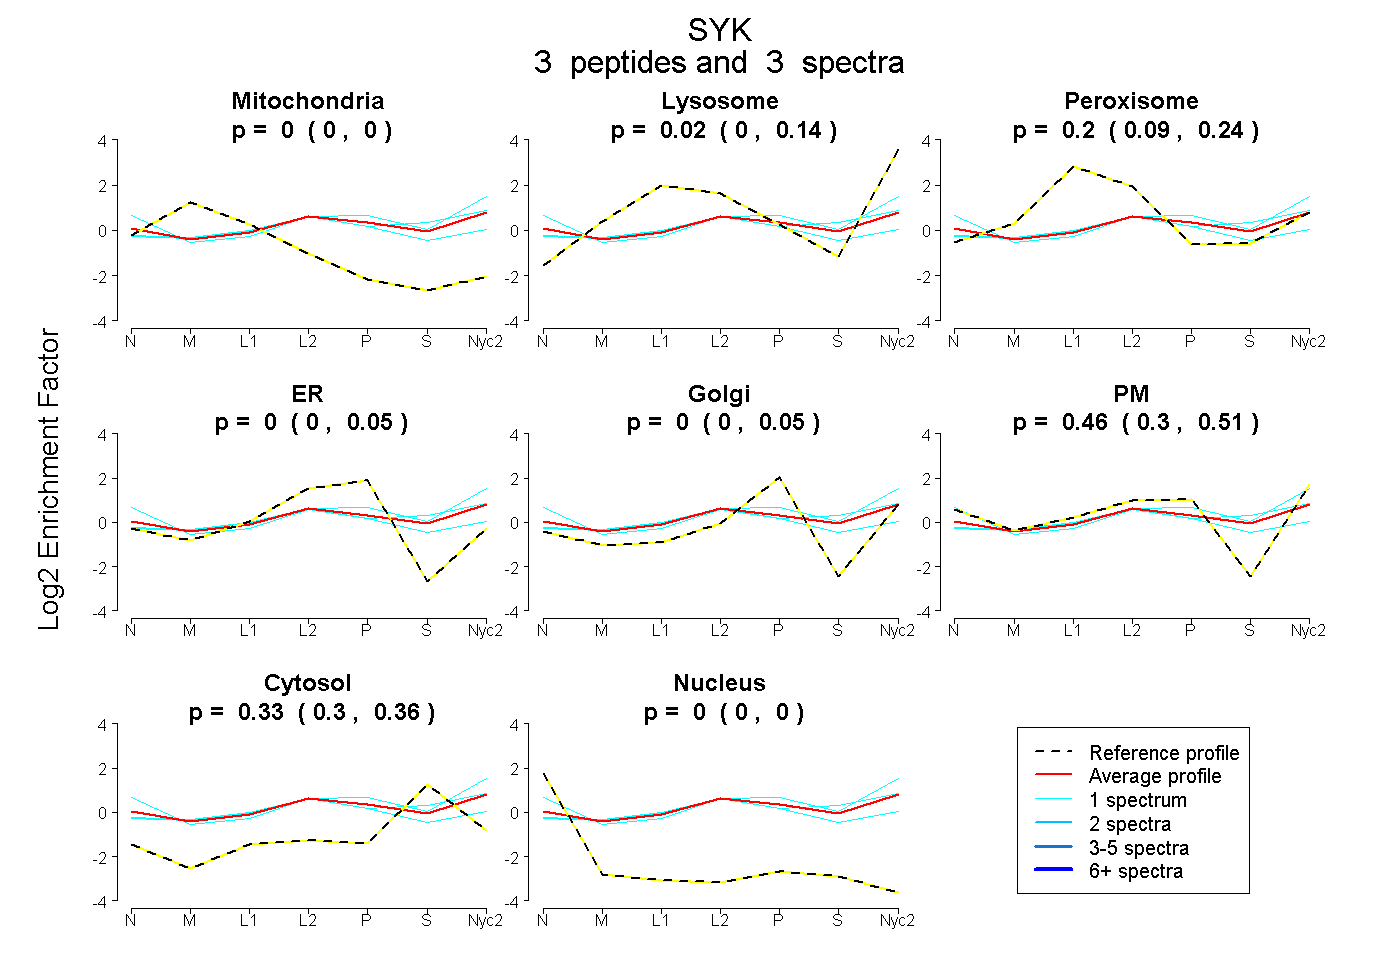
0.000 | 0.000
0.000 | 0.145
0.089 | 0.238
0.000 | 0.049
0.000 | 0.050
0.296 | 0.506
0.296 | 0.356
0.000 | 0.000
| Plot | Mito | Lyso | Perox | ER | Golgi | PM | Cytosol | Nucleus | |||||
| Expt A |
3 peptides |
3 spectra |
|
0.000 0.000 | 0.000 |
0.019 0.000 | 0.145 |
0.195 0.089 | 0.238 |
0.000 0.000 | 0.049 |
0.000 0.000 | 0.050 |
0.458 0.296 | 0.506 |
0.328 0.296 | 0.356 |
0.000 0.000 | 0.000 |
| 1 spectrum, YLEESNFVHR | 0.000 | 0.127 | 0.192 | 0.000 | 0.000 | 0.305 | 0.375 | 0.000 | ||
| 1 spectrum, NVLLVTQHYAK | 0.000 | 0.286 | 0.015 | 0.000 | 0.000 | 0.391 | 0.308 | 0.000 | ||
| 1 spectrum, NYLGGFALSVAHNR | 0.000 | 0.000 | 0.195 | 0.077 | 0.000 | 0.396 | 0.260 | 0.072 |
| Plot | Lyso | Other | |||||||||||
| Expt C |
4 peptides |
7 spectra |
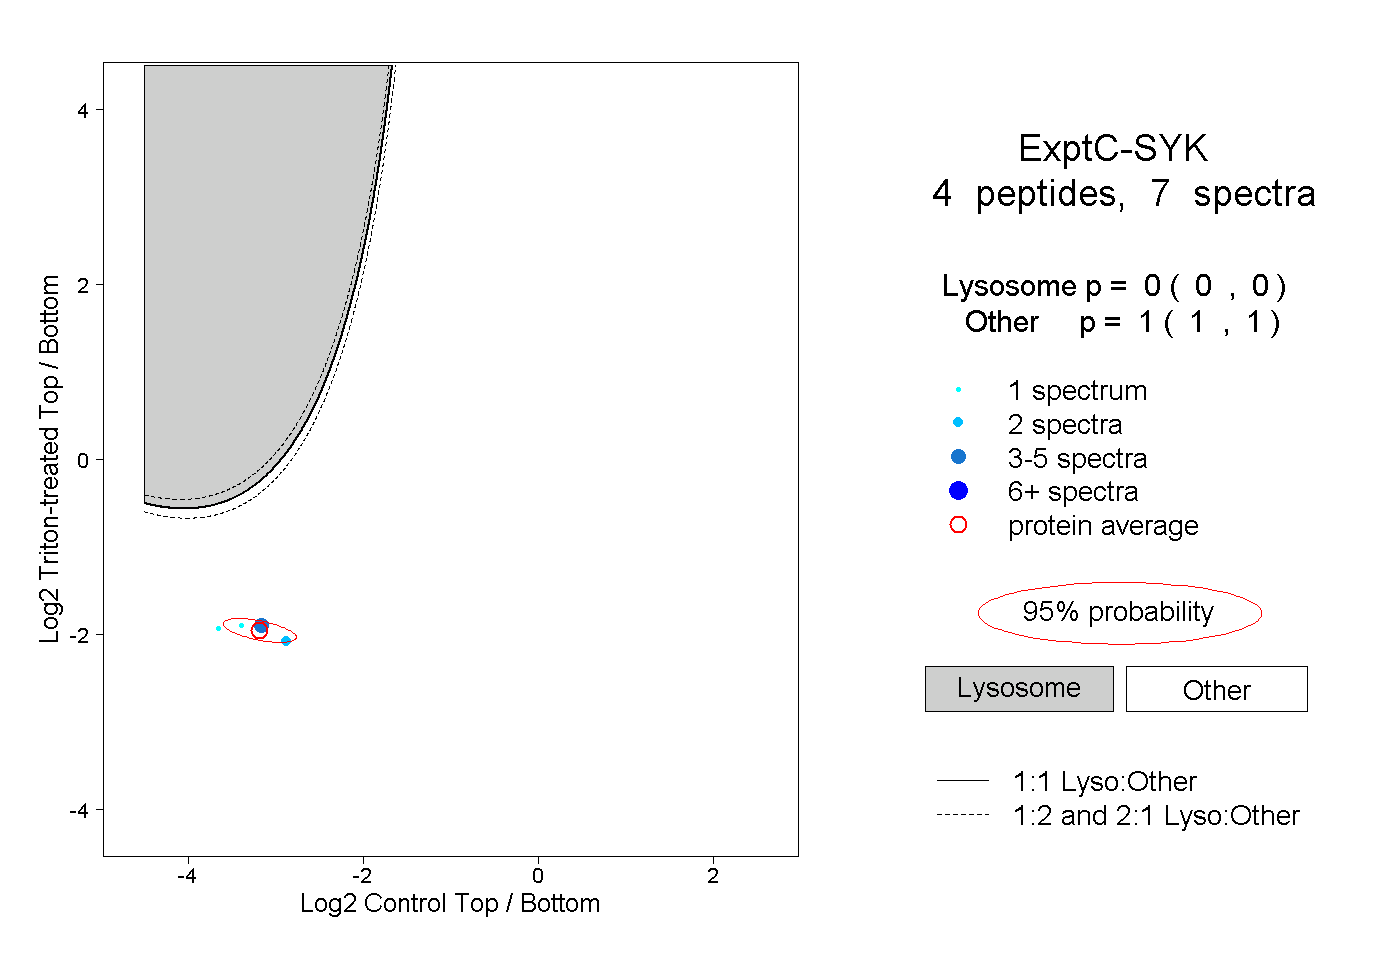 |
0.000 0.000 | 0.000 |
1.000 1.000 | 1.000 |