 3
3peptides
spectra

0.000 | 0.000
0.000 | 0.000
0.000 | 0.000
0.390 | 0.878
0.000 | 0.327
0.000 | 0.211
0.000 | 0.000
0.025 | 0.197
| Plot | Mito | Lyso | Perox | ER | Golgi | PM | Cytosol | Nucleus | |||||
| Expt A |
3 peptides |
4 spectra |
|
0.000 0.000 | 0.000 |
0.000 0.000 | 0.000 |
0.000 0.000 | 0.000 |
0.869 0.390 | 0.878 |
0.000 0.000 | 0.327 |
0.000 0.000 | 0.211 |
0.000 0.000 | 0.000 |
0.131 0.025 | 0.197 |
| 2 spectra, QEAIAAAR | 0.010 | 0.000 | 0.000 | 0.467 | 0.034 | 0.489 | 0.000 | 0.000 | ||
| 1 spectrum, GEEPLSARPALETESLR | 0.000 | 0.000 | 0.000 | 0.170 | 0.408 | 0.327 | 0.094 | 0.000 | ||
| 1 spectrum, MQEDLNAQVEK | 0.000 | 0.000 | 0.000 | 0.673 | 0.000 | 0.000 | 0.000 | 0.327 |
| Plot | Lyso | Other | |||||||||||
| Expt C |
1 peptide |
1 spectrum |
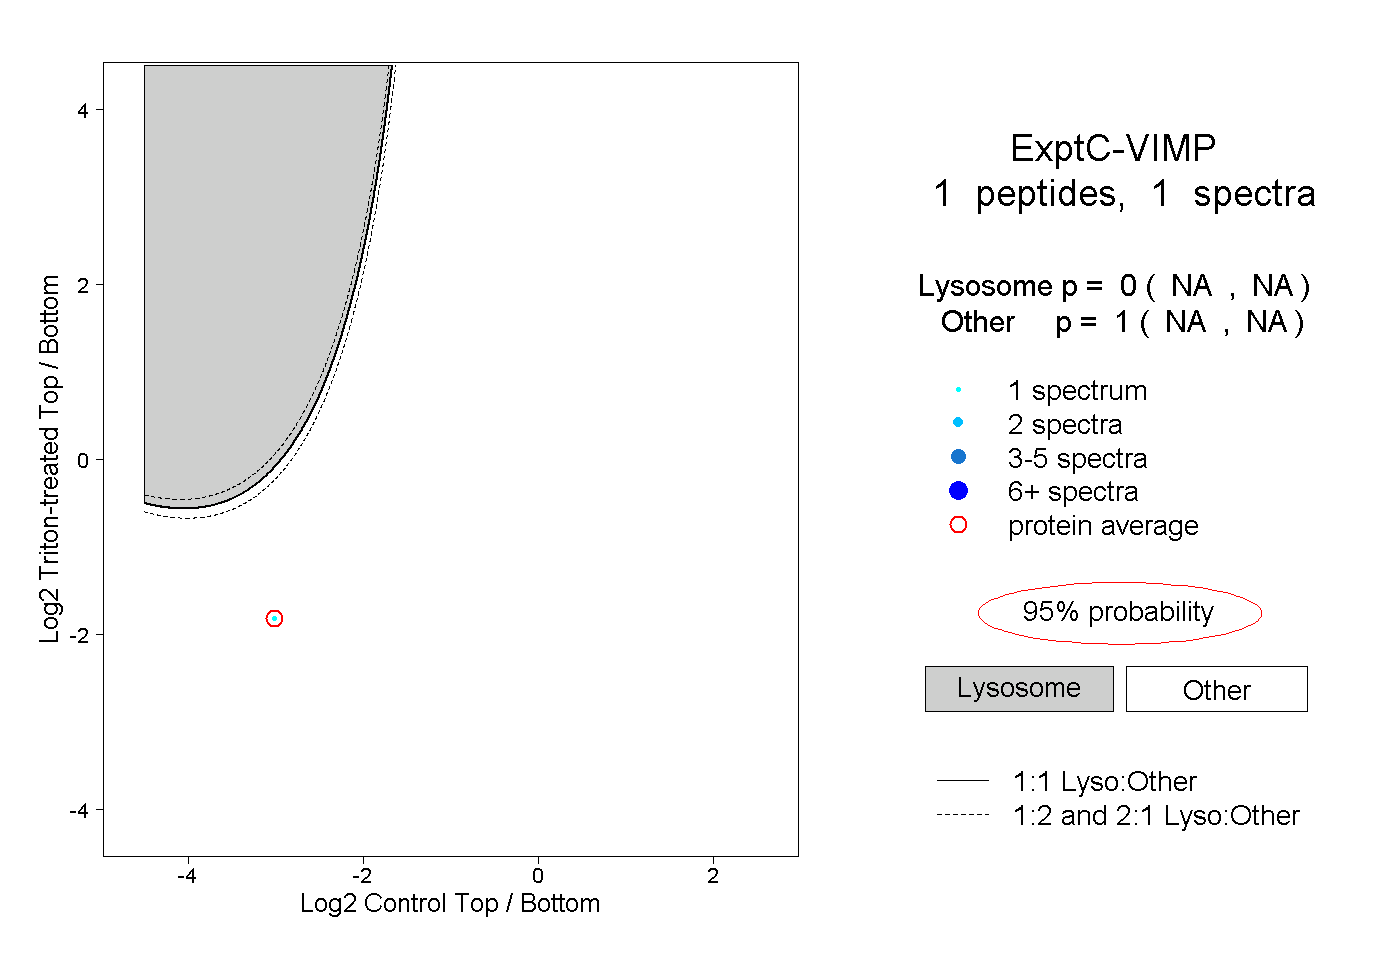 |
0.000 NA | NA |
1.000 NA | NA |